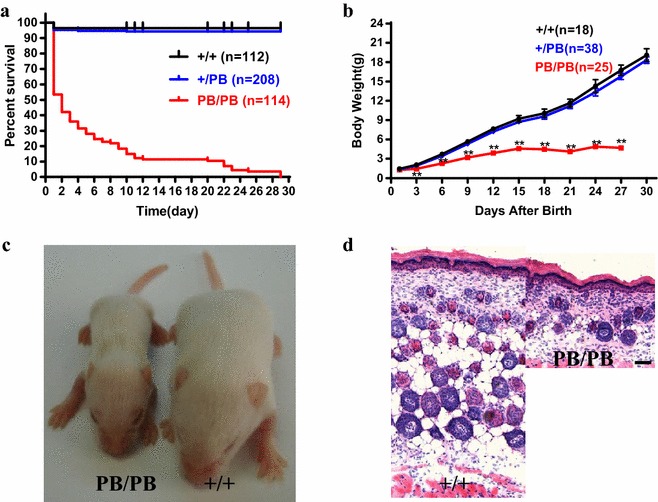
Fig. 2.

Postnatal lethality and growth retardation in Otg1 mutant mice. a Survival curves of Otg1 PB/PB (n = 114), Otg1 PB/+ (n = 208) and wild-type (n = 114) littermates. b Body weight curves of Otg1 PB/PB (n = 25), Otg1 PB/+ (n = 38) and wild-type (n = 18) littermates. c Representative image showing the body size difference between an Otg1 PB/PB and a wild-type mouse at P11. d Representative image of the hypodermis histological section of P4 Otg1 PB/PB and Otg1 +/+ mice, showing severe lipodystrophy of the mutant
