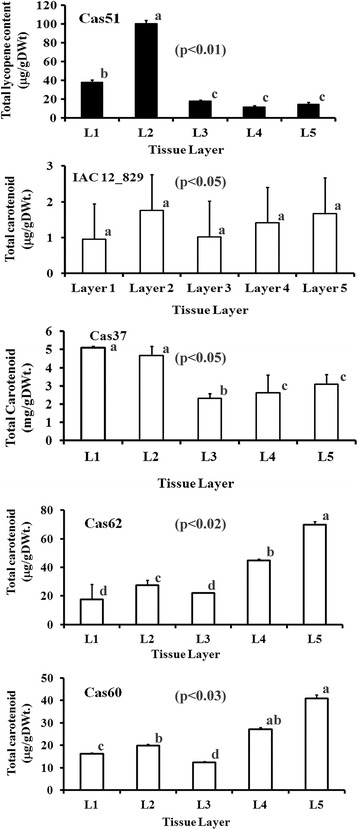
Fig. 2.

Total carotenoid content distribution across tissue sampling. Tissue layer samples were obtained from a cross section of ten month old storage roots in five landraces with the most contrasting HPLC_DAD profile and variable amounts of total carotenoid. Total carotenoid was estimated using a spectrophotometer for landraces IAC12.829 (White SR), Cas51 (Pink SR), Cas37 (Pale Yellow SR), Cas62 (Intense Yellow SR), and Cas60 (Yellow SR). Values in parenthesis refer to p_value (p < 0.05) obtained with three biological replications by Kruskal-Wallis statistical test and significance between values is designated by different letters
