Fig. 3.

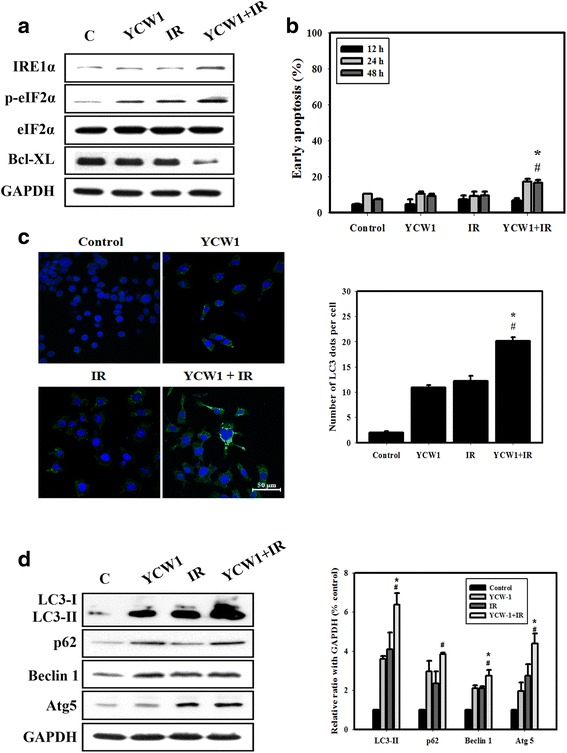
Measurement of cell death and ER stress in 4 T1 cells. a The expression levels of ER stress-related proteins were measured by western blot analysis following treatment with YCW1 and IR alone or in combination. Cells were treated with YCW1 (1 μM) and IR (4 Gy) for 12 h. b Early apoptosis, detected using an Annexin V apoptosis detection kit, was measured using flow cytometry. Cells were treated with YCW1 (1 μM) and IR (4 Gy) for 48 h. c Immunofluorescence staining of the LC3 protein in 4 T1 cells treated with YCW1 (1 μM) and IR (4 Gy) for 48 h. Representative cell images showing punctate LC3 distribution using a confocal microscope. Quantitative data calculating the number of LC3 dots per cell. #, p < 0.05, IR versus combined treatment. *, p < 0.05, YCW1 versus combined treatment. Data are presented as the mean ± standard deviation of three independent experiments. d The expression levels of autophagic-related proteins were measured by western blot analysis following treatment with YCW1 and IR alone or in combination. The densities of the bands were quantified with a computer densitometer (AlphaImager™ 2200 System Alpha Innotech Corporation, CA, USA). Cells were treated with YCW1 (1 μM) and IR (4 Gy) for 48 h. #, p < 0.05, IR versus combined treatment. *, p < 0.05, YCW1 versus combined treatment
