
Fig. 1.
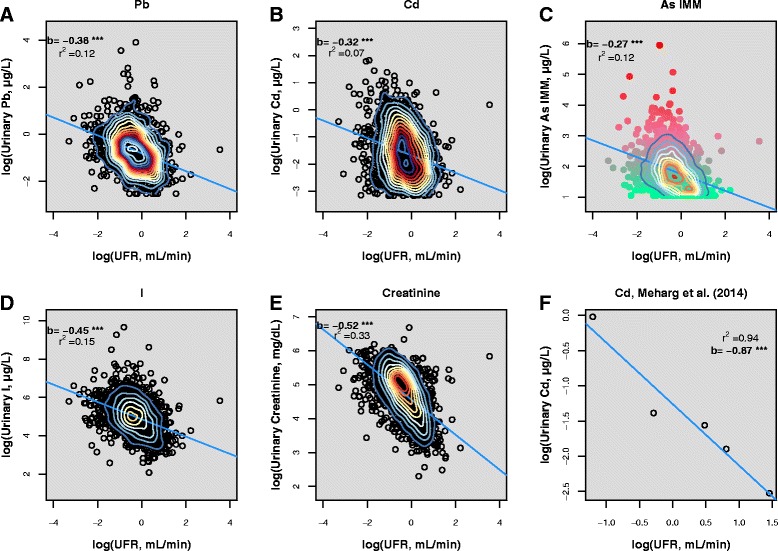
Unadjusted urinary Pb (a), Cd (b), AsIMM (c), I (d) and creatinine (e) plotted against UFR (NHANES 2009–2012 (CDC, 2015) training data). Multiple spot Cd measurements (Meharg et al., 2014) from a single volunteer are shown for comparison (f). Linear regression lines (blue) are displayed with regression slopes and r2 values. *** denotes significance to p < 0.001. Point density contours were plotted using two-dimensional kernel density estimation. In (c), the transition from green to red depicts increasing concentration of urinary dimethylarsonic acid (DMA)