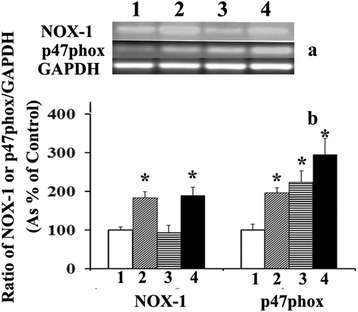
Fig. 2.

Gene expression of NOX-1 and p47phox in RASMC cultured in serum free medium (lane 1) or 5 μg/ml of phytanic acid (lane 2) or 5 % FBS (lane 3) or FBS and phytanic acid (lane 4). Panel A shows the representative bands for mRNA levels of NOX-1, p47 phox and GAPDH. Panel B shows the percent ratio of NOX/GAPDH or p47phox/GAPDH in RASMC. Values are Mean ± SD of at least six measurements. *p < 0.01 when compared with control (without FBS or phytanic acid)
