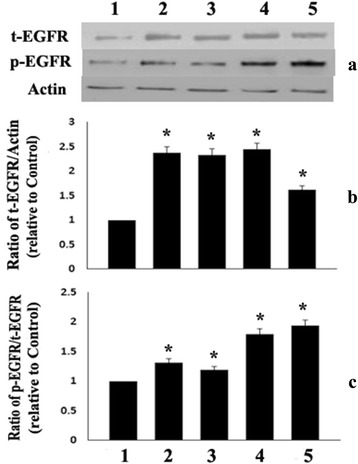
Fig. 4.

Panel a illustrates representative western blots of total EGFR protein (t-EGFR), phosphorylated EGFR (p-EGFR) and Actin in RASMC cultures. Panel b shows the levels of t-EGFR and panel C illustrates the ratio of p-EGFR/t-EGFR in RASMC treated with 2.5 μg/ml (lane 2), 5.0 μg/ml (lane 3) or 10 μg/ml (lane 4) of Phytanic acid. Lane 1 represents RASMC without any treatment whereas lane 5 had RASMC treated with 10 μg/ml of PA and 5 % FBS. Values are Mean ± SD of six measurements. * p < 0.1 when compared with control (lane 1)
