Fig. 3.

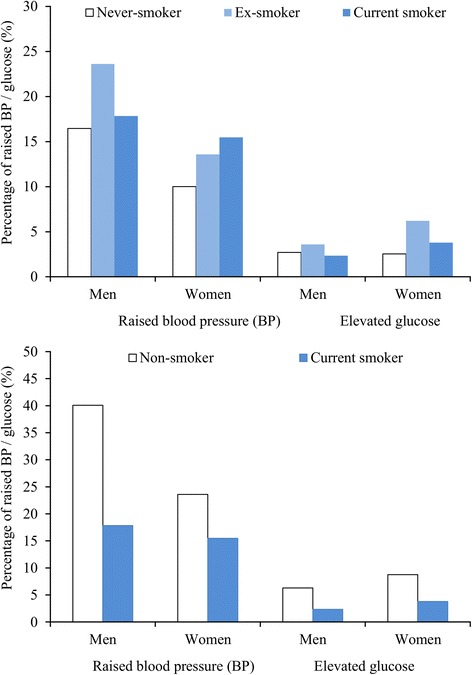
Proportions of respondents with raised blood pressure (BP) and elevated glucose classified by smoking status (Top: never-, ex- and current smoker; Bottom: non- and current smoker)

Proportions of respondents with raised blood pressure (BP) and elevated glucose classified by smoking status (Top: never-, ex- and current smoker; Bottom: non- and current smoker)