
Fig. 3.
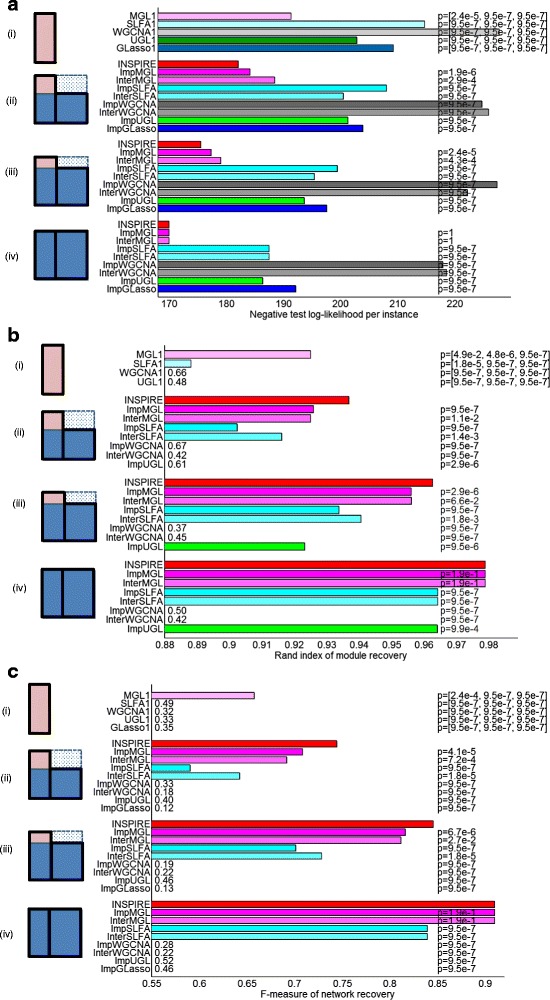
Illustration of the synthetic data, aligned with four groups of bars in each of (a)–(c). Rows represent genes and columns represent samples. a Negative test log-likelihood per instance averaged over 20 different instantiations of the synthetic data (lower is better). b Rand index for module recovery averaged over 20 different instantiations of the synthetic data. c F-measure for feature dependency recovery averaged over 20 different instantiations of the synthetic data. The Wilcoxon signed rank test p value represented on each bar (except the bars for INSPIRE) measures the statistical significance of the difference between the method and INSPIRE