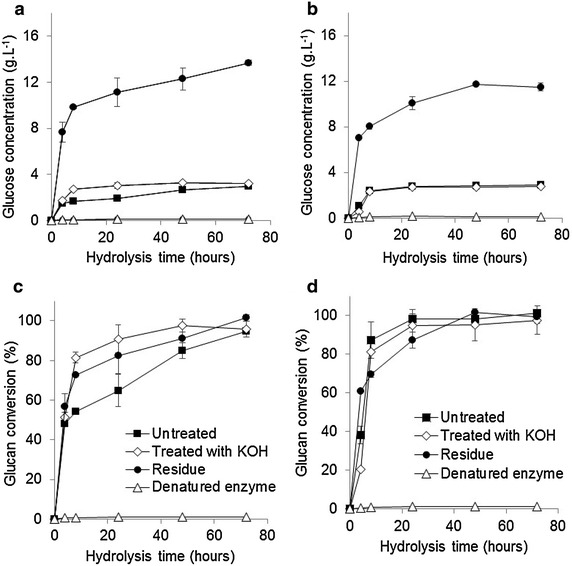
Fig. 5.

Glucose concentration and glucan conversion over time for enzymatic hydrolysis from K. alvarezii fractions cultivation for May 2013. a Glucose concentration of brown strain. b Glucose concentration of red strain. c Glucan conversion of brown strain. d Glucan conversion of red strain. (square filled) untreated material, (lozenge open) treated with KOH 6 % (w/v) material, (ball filled) residue and (triangle open) residue plus enzyme denature. All symbols apply to the graphs a–d. All reported data are the average values followed by their standard deviations
