
Fig. 2.
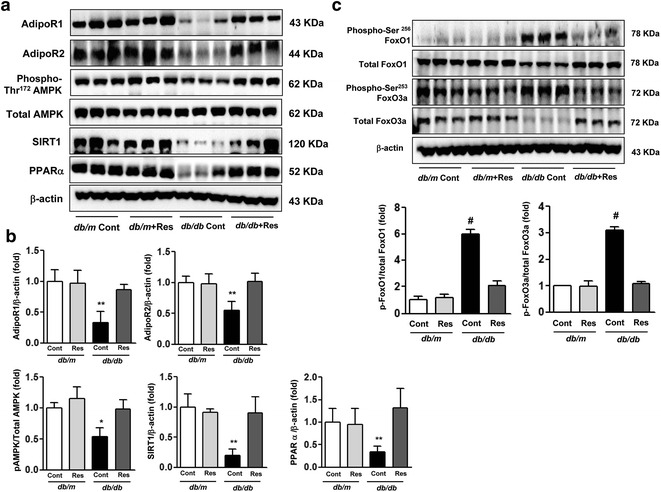
AdipoR1 and AdipoR2, phospho-Thr172 and total AMPK, SIRT1, PPARα and FoxO expression in the renal cortex of db/m and db/db mice with or without resveratrol. Protein lysates (40 μg) from renal cortex were separated by SDS–PAGE and analyzed by western blot. a Representative results are shown for AdipoR1 and AdipoR2, phospho-Thr172 and total AMPK, SIRT1, PPARα and β-actin. b Quantitative analyses of areas for AdipoR1 and AdipoR2, SIRT1 and PPARα, all relative to β-actin and phospho-Thr172 AMPK/total AMPK. *p < 0.05 and **p < 0.01 vs. db/m, db/m Res and db/db Res mice respectively. c Representative results for phospho-Ser256 and total FoxO1 and phospho-Ser253 and total FoxO3a and β-actin; quantitative analyses are for phosphorylated relative to total protein. #p < 0.001 vs. db/m, db/m Res and db/db Res mice. Adipo R adiponectin receptor, AMPK 5′-adenosine monophosphate-activated protein kinase, SIRT1 silent information regulator T1, PPARα peroxisome proliferator-activated receptorα, Res resveratrol, FoxO class O forkhead box