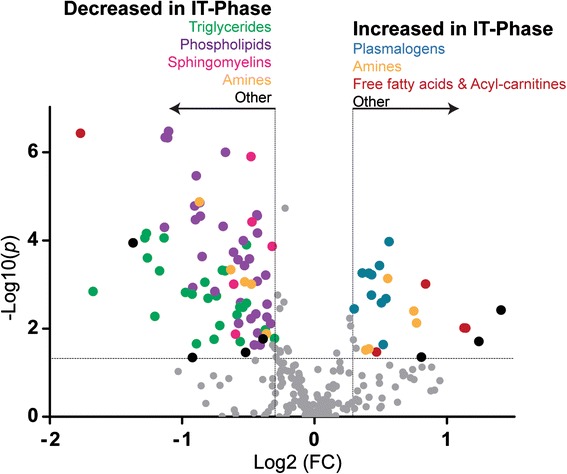
Fig. 2.

Volcano plot of the significant serum metabolites between the HCs and the IT phase. Metabolites with a fold change (FC; x-axis) threshold of ≥1.20 or ≤0.80 and t-tests (y-axis) threshold of 0.05 are identified as significant and represented by colored circles ordered by the metabolite class. The further its position away from (0,0), the more significant the metabolite. Metabolite classes are as follows: triglycerides, green; phospholipids, purple; sphingomyelins, pink; amines, orange; plasmalogens, blue; free fatty acids and acyl carnitines, maroon; others, black
