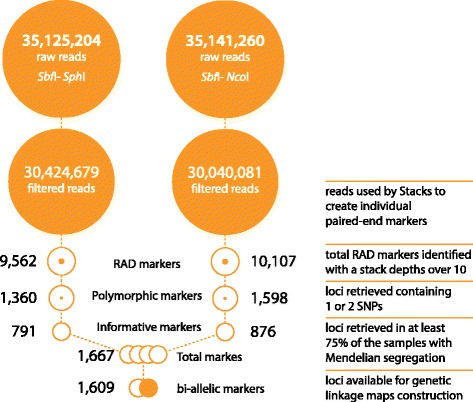
Fig. 1.

Pictorial summary of the sequencing pipeline. Total numbers of reads obtained from each library are shown; raw and filtered for low quality sequences (quality score < 20) and reads with missing or ambiguous barcodes, followed by the number of polymorphic ddRAD markers identified by Stacks, and the number of informative markers that were subsequently used to generate genetic linkage maps and in genome-wide association studies
