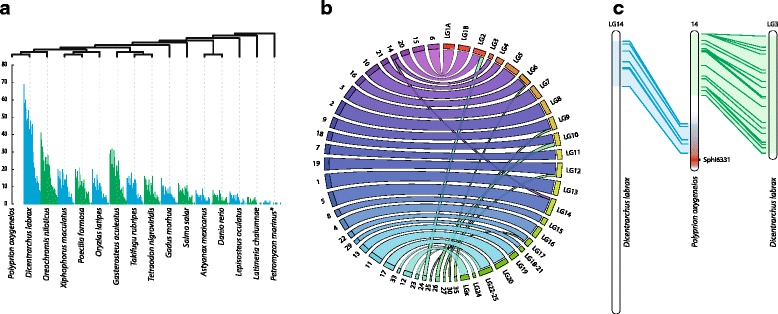
Fig. 5.

Comparative genomics analysis. a The percentage of P. oxygeneios ddRAD sequences per linkage group that showed homology with sequences from other fish genomes, listed on the x-axis; *P. marinus: outgoup. The phylogenetic tree provided above the graph is based on recent classifications [30–32]. b Schematic of homology between proposed linkage groups (1–35) and published D. labrax linkage groups. Only blocks of 2 markers or more are illustrated; The complete comparative analysis for all species is summarised in Additional file 11: Table S7. c Graphic identifying syntenic regions between P. oxygeneios LG 14 and D. labrax linkage groups
