Fig. 3.

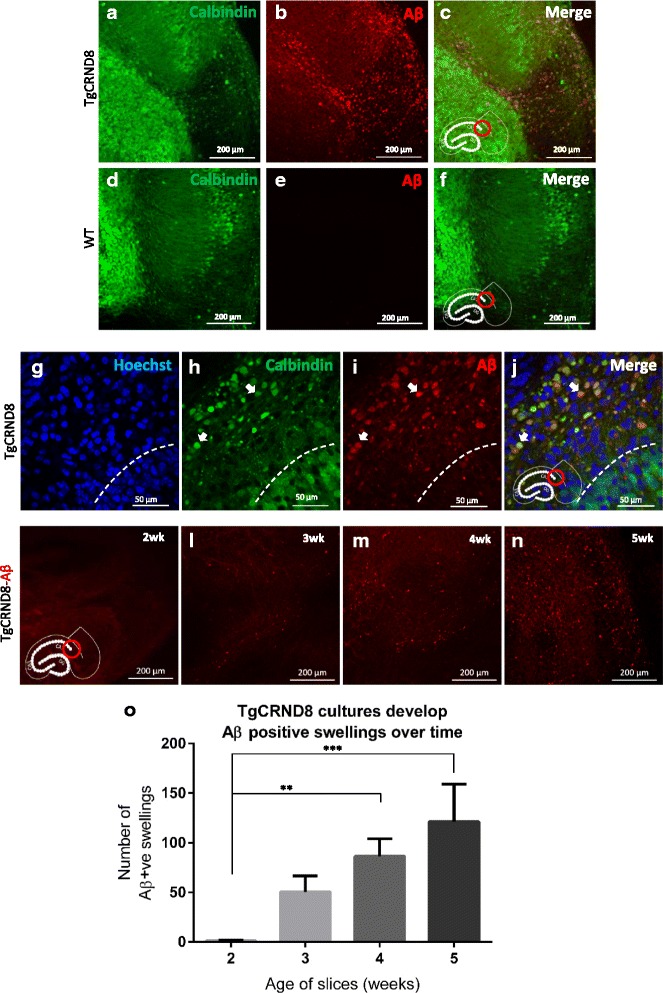
Intraneuronal Aβ accumulation in axons projecting from CA1. Where appropriate, image locations are denoted by the red ring on the hippocampus diagram inset in each panel. a-c Accumulation of Aβ in the CA1 region of a 5-week old TgCRND8 slice (d-f) no such Aβ staining is apparent in the same region in WT slices. g-j High magnification imaging of the Aβ containing region in a 6-week old old TgCRND8 slice. The cell bodies of CA1 (stained with calbindin) lie below the dashed line in these images. There is no strong colocalisation of Aβ with calbindin in this region, and no colocalisation with Hoechst, demonstrating lack of Aβ within the cell bodies of CA1. Above the dashed line lies the alveus, an axonal tract containing calbindin positive axons derived from CA1 (h). Many of these axons have large swellings, which do not colocalise with Hoechst (demonstrating these swellings are not cell bodies). There is however extensive colocalisation of these axonal swellings with Aβ (i) as indicated by the arrow heads. k-n 2,3, 4 and 5-week old TgCRND8 slices stained with MOAB reveal a progressive accumulation of Aβ positive swellings. o Quantification of Aβ positive swellings (total count) in 2-5-week old old slices. There is a significant increase in these structures over time (1 way ANOVA p < 0.05, n = 12 slices per timepoint (3 slices per mouse))
