Fig. 4.

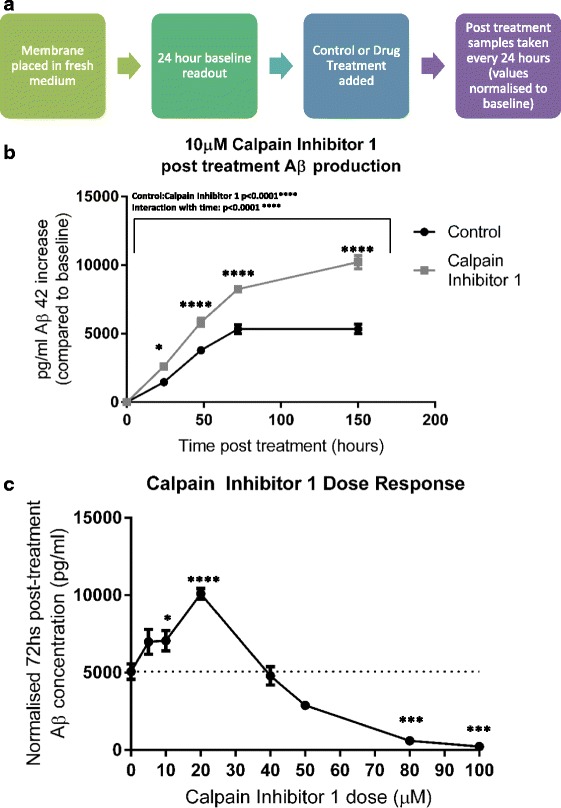
Treatment with Calpain Inhibitor 1 increases Aβ accumulation in TgCRND8 slice culture medium (a) Protocol for testing the effect of drug treatments. The slice membrane is placed in fresh maintenance medium and left for 24 hs. A 50 μL sample of medium is then taken to act as a “24 h baseline production” readout. Calpain Inhibitor 1 (or DMSO control) is then added to the culture, with treated medium allowed to soak through the slice from above. Timepoints are then taken at 24, 48, 72 and 150 hs post treatment and normalised to the 24 h baseline readout. (b) 10 μM Calpain Inhibitor 1 increases Aβ accumulation in slice culture medium to almost double that of control. (2 way ANOVA p < 0.0001(Large bar above) (stars on graph represent significance between treated and untreated at each timepoint via ANOVA multiple comparisons). Results are pooled from 3 independent experiments. n = 9 membranes per treatment (2 membranes arise from each mouse and are split between treated and control, so all samples within a condition are from different animals) (c) By changing dosage of Calpain Inhibitor 1 and sampling at 24 h baseline, then 72 h post treatment, a dose-response curve is revealed; 20 μM giving peak production, whilst concentrations above 40 μM reduce Aβ production to below that of control levels (1 Way ANOVA p < 0.05 (stars represent significant deviation from 0 μM treatment) n numbers: 0 μM = 11, 5 μM = 5, 10 μM = 12, 20 μM = 12, 40 μM = 5, 50 μM = 2, 80 μM = 3, 100 μM = 3. (Note n numbers are lower above 40 μM due to increased off-target toxicity in the culture system. All membranes used in each dose condition originated from different animals))
