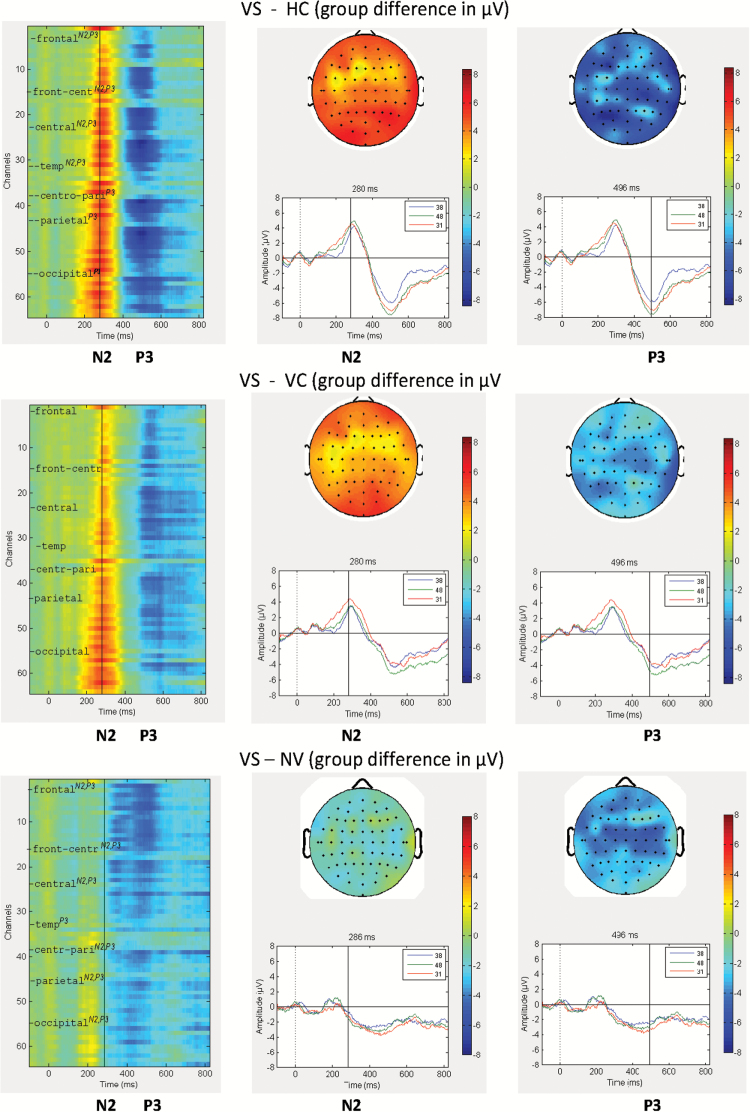
Fig. 2.
Heat maps, topographical distribution, and Event-Related Potential (ERP) waveforms for the group difference in averaged ERPs in response to stimuli with negative valence in violent subjects with schizophrenia (VS) contrasted to Healthy Controls (HC), Nonpsychotic Violent subjects (NPV), and Nonviolent patients (NV). Notes: (1) In each panel (top, middle, bottom), the figures show the heatmap, the topograpical map (ie, voltage distribution in microvolts) over the scalp (at cursor position for N2 and P3), and the ERP curves at Fz, Cz and Pz electrodes. (2) Color coding: Color bars indicate pairwise group differences of grand averages in microvolts. (3) Channels for the topograpical map are ordered from frontal to occipital, with left and right side interleaved. (4) Channel assignments for the heatmap for the broader scalp regions (frontal, fronto-central, central, fronto-temporal, temporal, temporo-parietal, centro-parietal, parietal, parieto-occipital, occipital) are indicated by the tickmarks. Superscripts indicate significant group differences for a given ERP component (N2, P3). (5) Inlets display: ERP group difference waveform for channels Fz (=38), Cz (=48) and Pz (=31), respectively.

