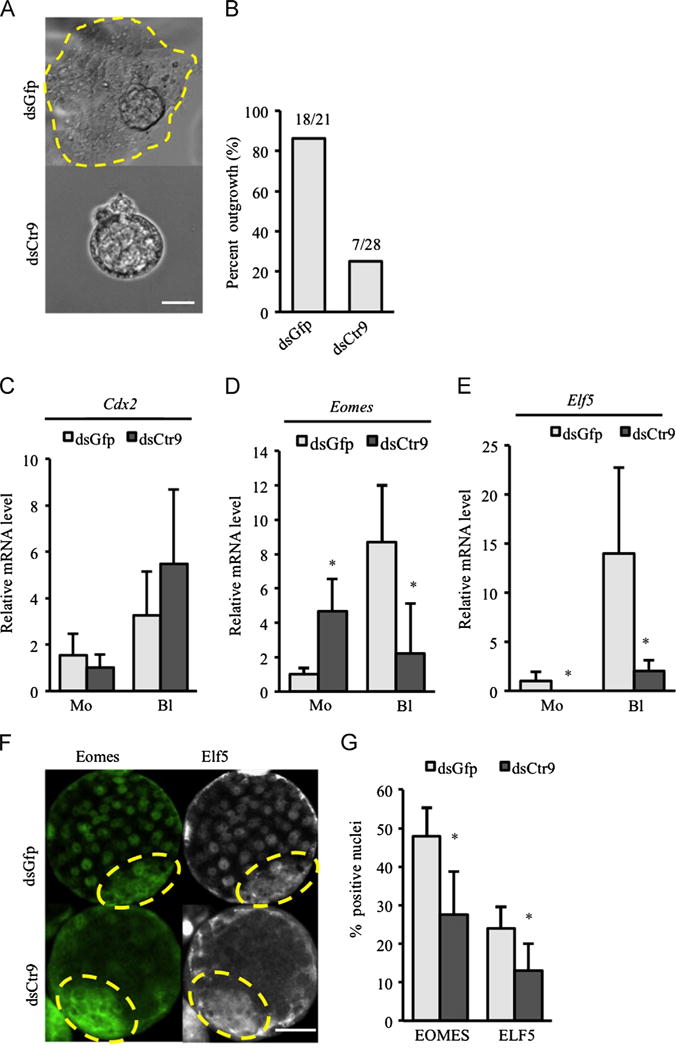
Fig. 2.

CTR9 deficiency results in failure of trophectoderm outgrowth. (A) Typical outgrowths are observed in control embryos after 3 days in culture (A, circle in upper panel). Failure of blastocyst outgrowth was observed in dsCtr9 embryos (A, lower panel). Scale bar: 20 μm. (B) Quantification of outgrowth potential for dsGfp and dsCtr9 embryos (21 dsGfp and 28 dsCtr9 blastocysts were analyzed). (C–E) Expression of trophectoderm specific genes Cdx2 (C), Eomes (D) and Elf5 (E) in dsGfp and dsCtr9 embryos at morula and blastocyst stages (5–10 embryos/pool, two independent experiments). Asterisks indicate P<0.05. Error bars represent SEM. (F) EOMES and ELF5 protein are reduced in dsCtr9 blastocysts. ICM area is circled with dotted line. Scale bar: 50 μm. (G) Graph representing percent EOMES positive or ELF5 positive cells in dsGfp and dsCtr9 blastocysts (EOMES: 12 dsGfp and 12 dsCtr9 examined; ELF5: 7 dsGfp and 9 dsCtr9 embryos examined). Asterisks indicate P<0.05. Error bars represent SEM.
