Fig. 4.

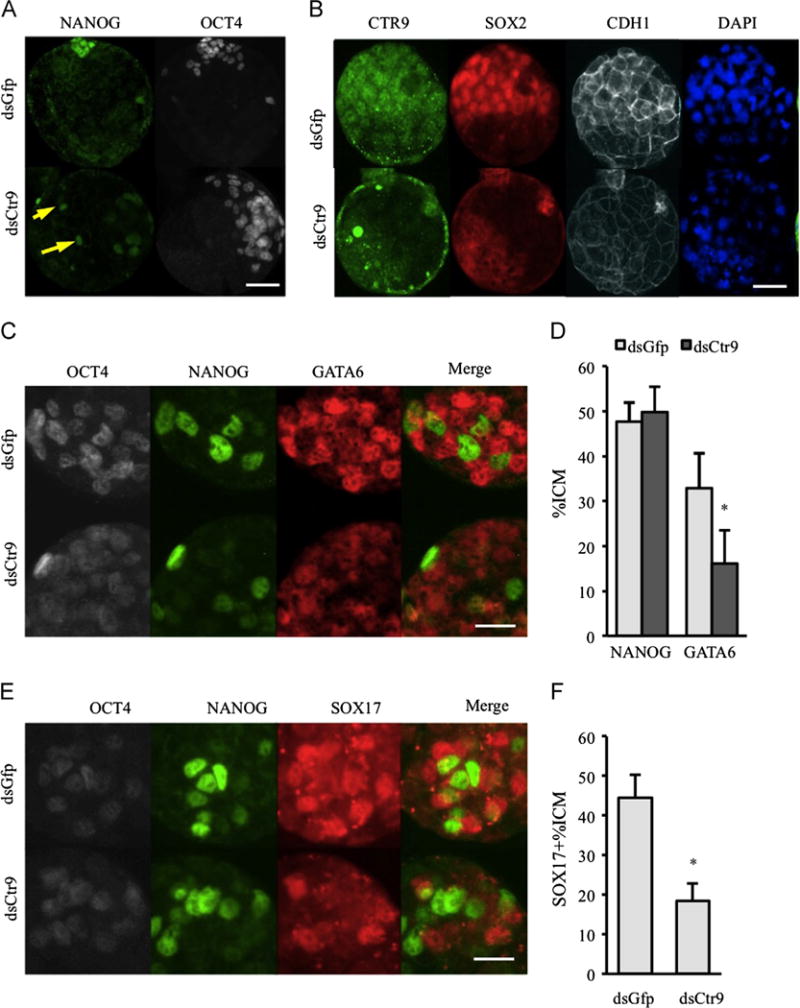
Molecular specification of ICM/EPI and PE is abnormal in absence of Ctr9. (A) NANOG is restricted to future epiblast cells in control embryos, but is ectopically detected in some trophectoderm cells (arrows) in dsCtr9 embryos (13 dsGfp and 21 dsCtr9 expanded blastocysts analyzed). (B) SOX2 positive cells are reduced in absence of CTR9 (18 dsGfp and 23 dsCtr9 blastocysts analyzed). (C) GATA6 is restricted to primitive endoderm cells in control blastocysts. However, it remains expressed in the majority of blastomeres in dsCtr9 embryos (21 dsGfp and 22 dsCtr9 expanded blastocysts analyzed). (D) The percent of ICM cells that are NANOG positive is normal and the percent of highly expressing GATA6 (putative PE cells) cells is reduced in dsCtr9 blastocysts. (E,F) The number of SOX17 positive cells is greatly reduced in dsCtr9 expanded blastocysts (14 dsGfp and 13 dsCtr9 embryos analyzed). Scale bars in A,B are 50 μm. Scale bars in C and E are 25 μm. Asterisks indicate P<0.05. Error bars represent SEM.
