Fig. 6.

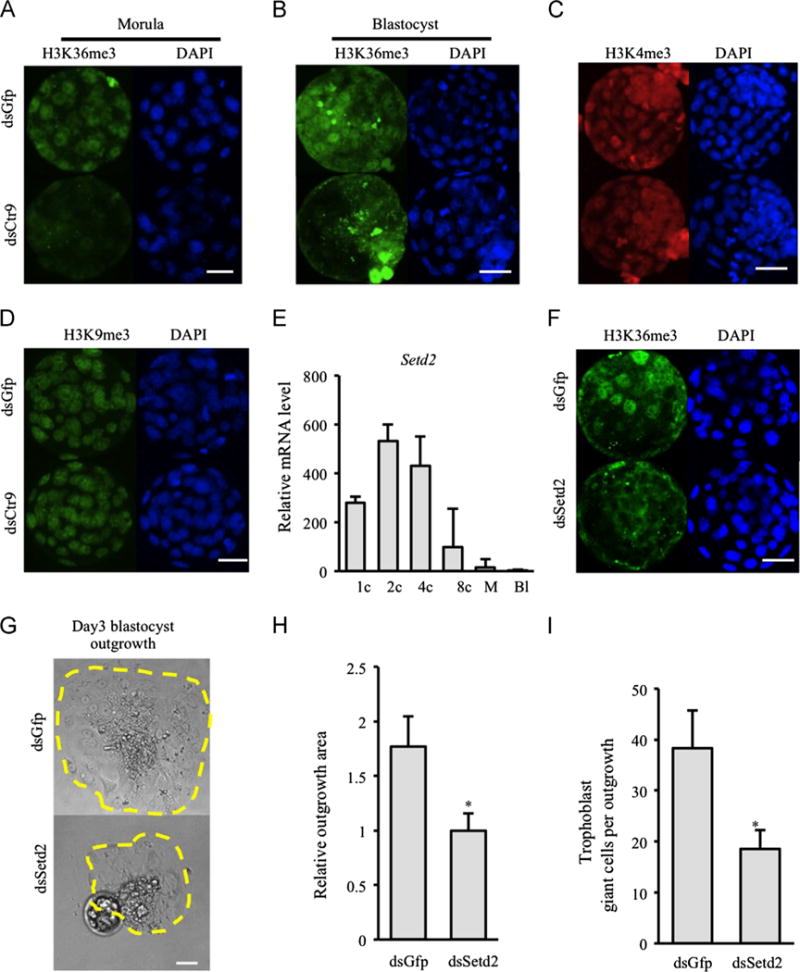
CTR9 deficiency results in global reduction of H3K36me3 in vivo. H3K36me3 is severely reduced in dsCtr9 morula (A) and blastocysts (B) (9 control and 10 dsCtr9 morula; 9 control and 13 dsCtr9 blastocysts were analyzed). Scale bar: 50 μm. (C–D) Normal level and distribution of H3K4me3 and H3K9me3 were observed in dsCtr9 embryos at all stages examined. Scale bar: 50 μm. Knock down of Setd2 (that mediates H3K36me3) similarly compromised blastocyst outgrowth potential (E), outgrowth area (F), as well as the number of trophoblast giant cells observed (G). Scale bar in E is 20 μm. Asterisks indicate P<0.05. Error bars represent SEM.
