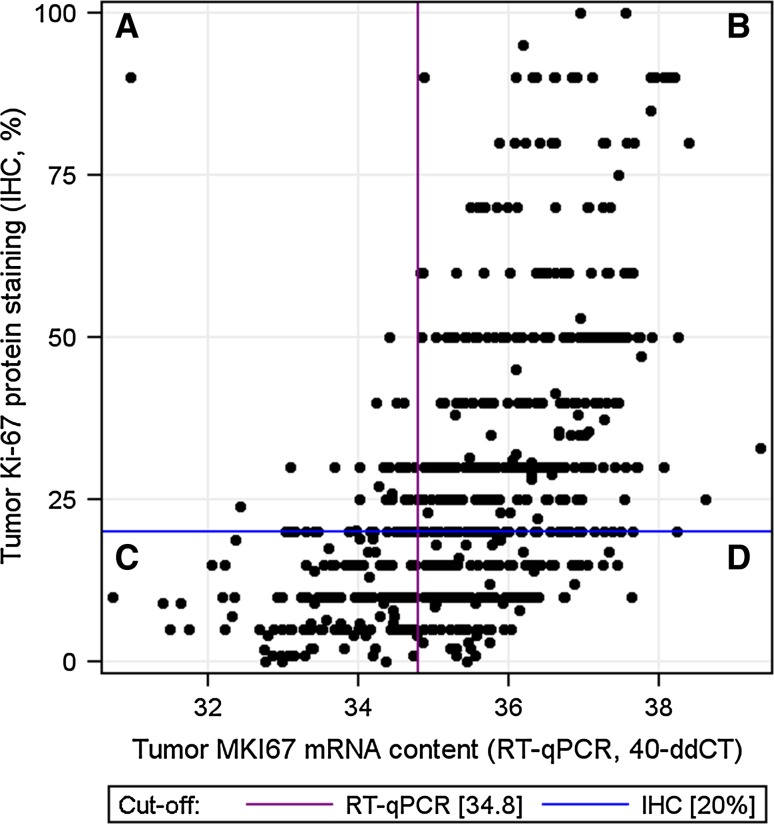
Fig. 1.
A scatterplot depicting the relation between tumour MKI67 mRNA content measured with RT-qPCR, and Ki-67 expression determined by immunohistochemistry (IHC). Vertical axis, tumour Ki-67 expression (IHC, %); horizontal axis, tumour relative MKI67 mRNA expression. The cut-off for positivity was 20 % in the Ki-67 protein assays (the horizontal line) and 34.8 in the MKI67 mRNA (qPCR) assays (the vertical line). Sections A and D depict the discordant cases, and sections B and C depict the concordant cases

