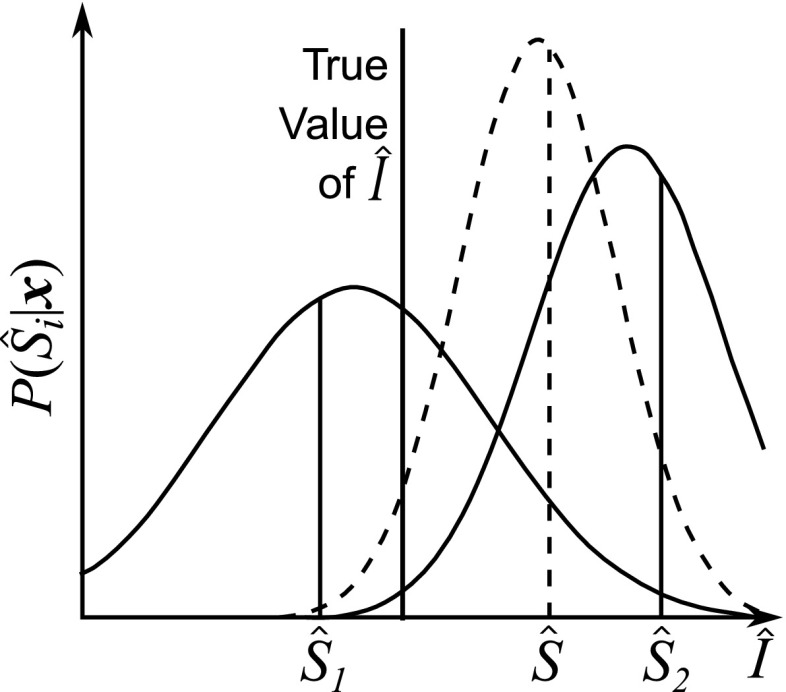
Fig. 15.
Maximum likelihood integration of two biased sensory channels. The probability distributions of the sensors and (shown by the solid lines) are both biased, i.e. their means do not correspond to the true value of . Using MLE causes this bias to carry through to the combined estimate given by the dashed line. Also note that the sensor with the largest variance does not necessary have the largest bias

