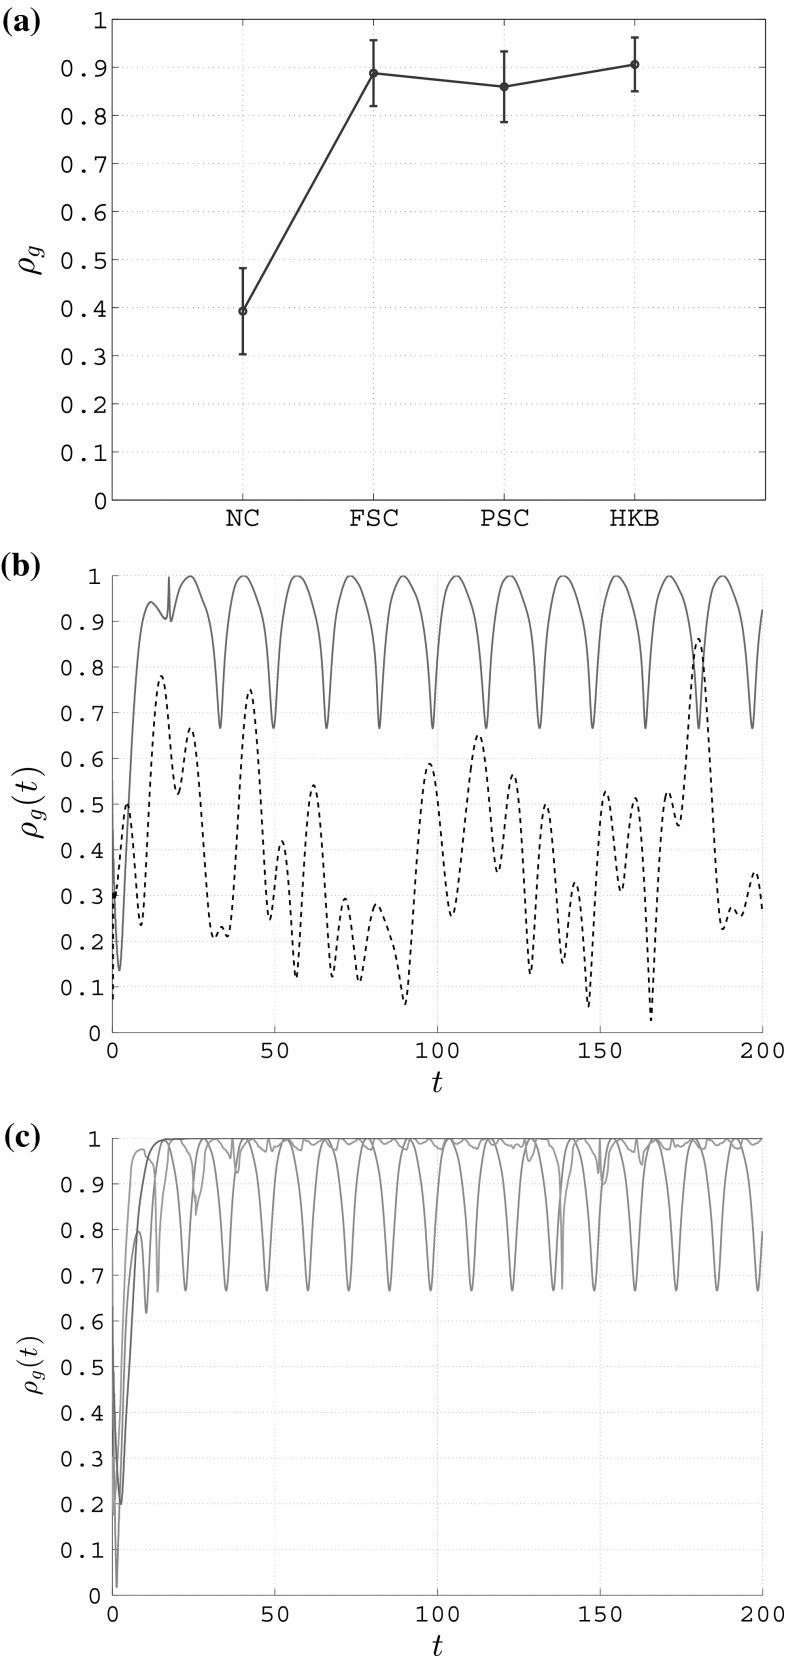
Fig. 2.
Group synchronization in an unweighted complete graph of heterogeneous RvdP oscillators. a Mean value (circle) and standard deviation (error bar); NC no coupling, FSC full state coupling (), PSC partial state coupling (), HKB HKB coupling (). b Trend over time—coupled and uncoupled scenario; black dashed line no coupling, red solid line full state coupling (). c Trend over time—comparison among the three couplings; red solid line full state coupling (), gray solid line partial state coupling (), light blue solid line HKB coupling ()

