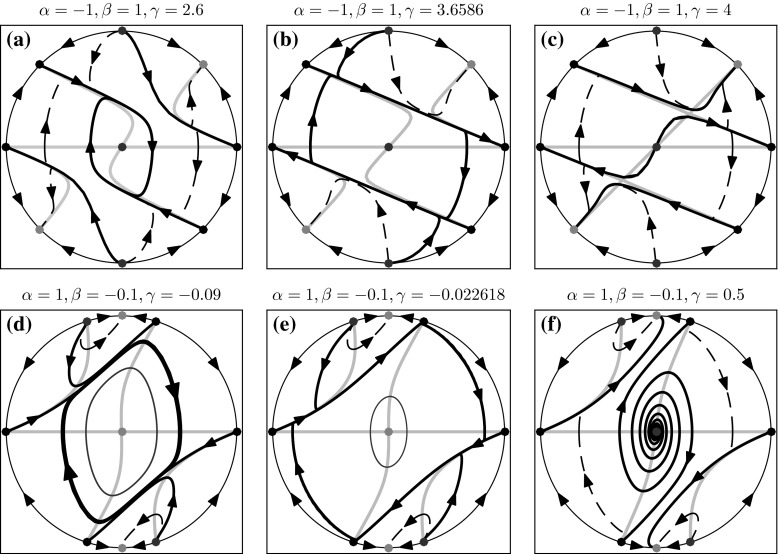
Fig. 2.
Global phase portraits of the system Eq. (2), projected on the (X, Y)-plane, for different parameters values. Green dots indicate stable equilibria; red dots indicate unstable equilibria; black dots indicate equilibria of a saddle type; red line indicates unstable periodic orbit; thick black lines indicate heteroclinic connections between different equilibria or between equilibria and stable periodic orbits; grey lines indicate nullclines; dashed lines examples of trajectories; arrows indicate direction of the flow (colour figure online)

