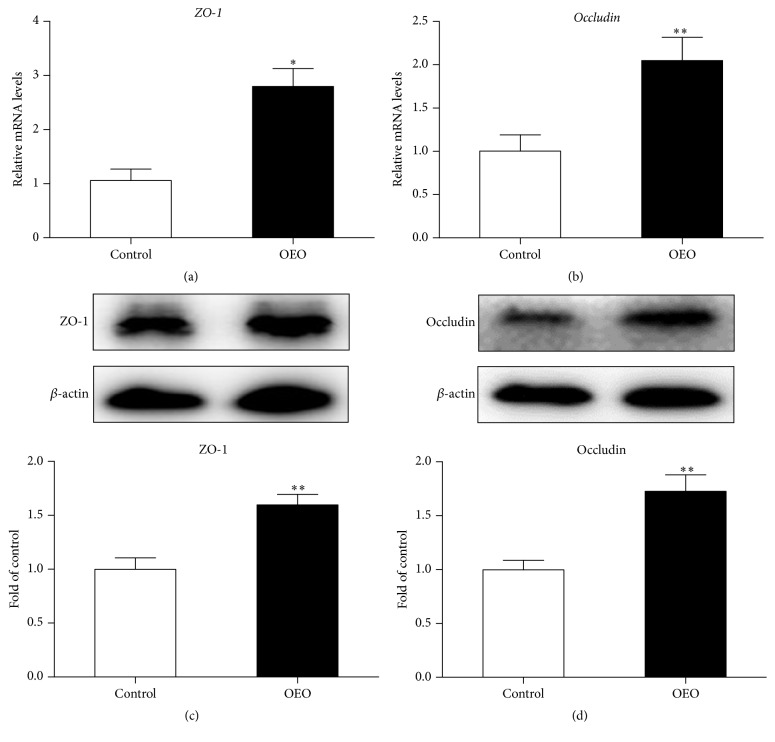
Figure 4.
Effect of OEO on the ZO-1 and occludin levels in the jejunum of pig. (a) ZO-1 mRNA level, (b) occludin mRNA level, (c) ZO-1 protein level, and (d) occludin protein level. Expression of the selected genes was quantified by quantitative reverse transcription-PCR. Equal loading was assessed by β-actin immunoblotting. Values are means ± SEM, n = 6. ∗Significantly different (P < 0.05) from the control group. ∗∗Significantly different (P < 0.01) from the control group. ZO-1, zonula occludens-1.

