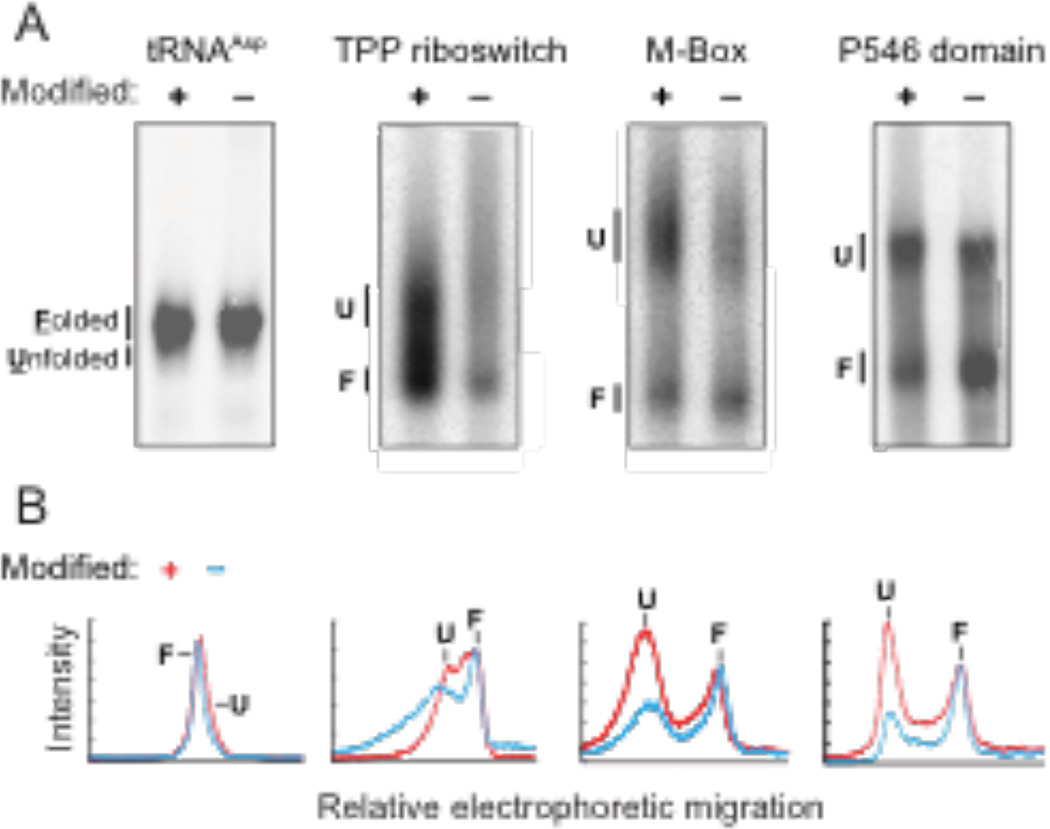
Figure 2.
Partitioning of RNA populations. (A) Folded and unfolded populations for modified and unmodified RNAs separated by non-denaturing gel electrophoresis in the presence of 50 mM NaCl and 5 mM MgCl2. For clarity, gel images were straightened and scaled to show similar representations for each RNA; band intensity profiles are unaltered. (B) Band intensities as a function of gel migration distance.

