Figure 3.
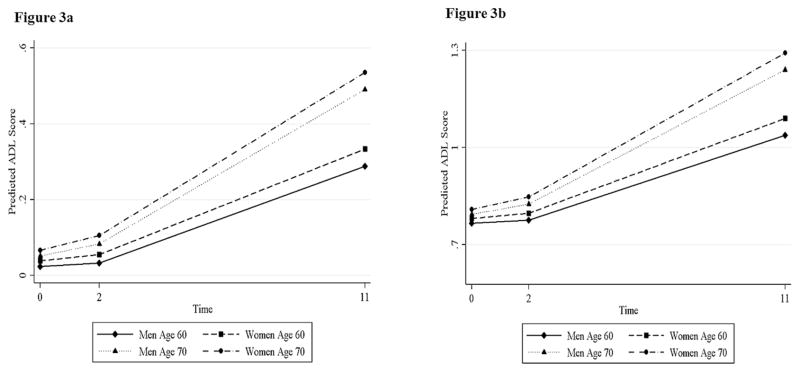
Figure 3a. Estimated 2001–2012 Trajectories of the Number of ADL Limitations for Respondents Aged 60 and 70 with Zero ADLs at Baseline by Gender
Note: Regression model shown in Table 2 is used to obtain predicted ADL score. Age is kept constant at 60 or 70 and ADL score at baseline is kept constant at 0. All other covariates included in the model are held constant at their mean value.
Source: Author's calculations with data from the Mexican Health and Aging Study27–29.
Figure 3b. Estimated 2001–2012 Trajectories of the Number of ADL Limitations for Respondents Aged 60 and 70 with One ADL at Baseline by Gender
Note: Regression model shown in Table 2 is used to obtain predicted ADL score. Age is kept constant at 60 or 70 and ADL score at baseline is kept constant at 1. All other covariates included in the model are held constant at their mean value. Source: Author's calculations with data from the Mexican Health and Aging Study27"29.

