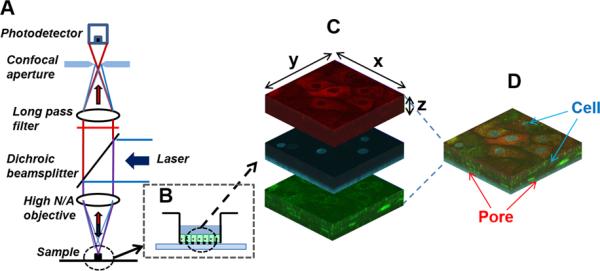
Fig. 1.

Schematic diagram of experimental settings. (A) Confocal laser fluorescent microscopy geometry with (B) the specimen in Transwell™ insert. With the pinhole at the confocal image plane, this system reduces the out-of-focus noise contribution, while allowing only in-focus signal from the pinhole to be detected. (C) A transwell insert containing the cell layers stained with fluorescent probe molecules (MTR (red), HOE (blue), and LTG (green)) was located on the chamber slide mounted with buffer, followed by confocal microscopic imaging equipped with three different fluorescent channels. (D) With the scanning mode for Z-stacks, the images obtained from the cell layers in porous supports could be reconstructed into three dimensions (3D).
