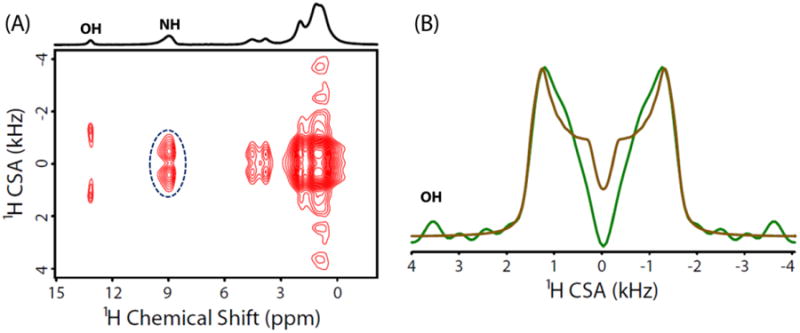
Figure 3.

(A) Two-dimensional 1H/1H CSA/CS correlation spectrum of NAVL at 600 MHz under 70 kHz MAS obtained using a previously reported pulse sequence23 with a 180° pulse in the middle of the CSA recoupling period on the 15N channel to decouple 15N-1H heteronuclear interactions. In the 2D 1H/1H CSA/CS correlation experiment 6 scans were collected every 32 t1 increments and a recycle delay of 5 s was used (total experimental time = 16 minutes). Dotted circle indicates the two overlapped amide proton resonances. (B) The experimental CSA lineshape extracted by taking a slice (green line) parallel to the 1H CSA dimension of the 2D spectrum at the 1H isotropic chemical shift frequency of OH resonance of NAVL. Best fitting simulated lineshape (brown) was obtained using SIMPSON simulations.
