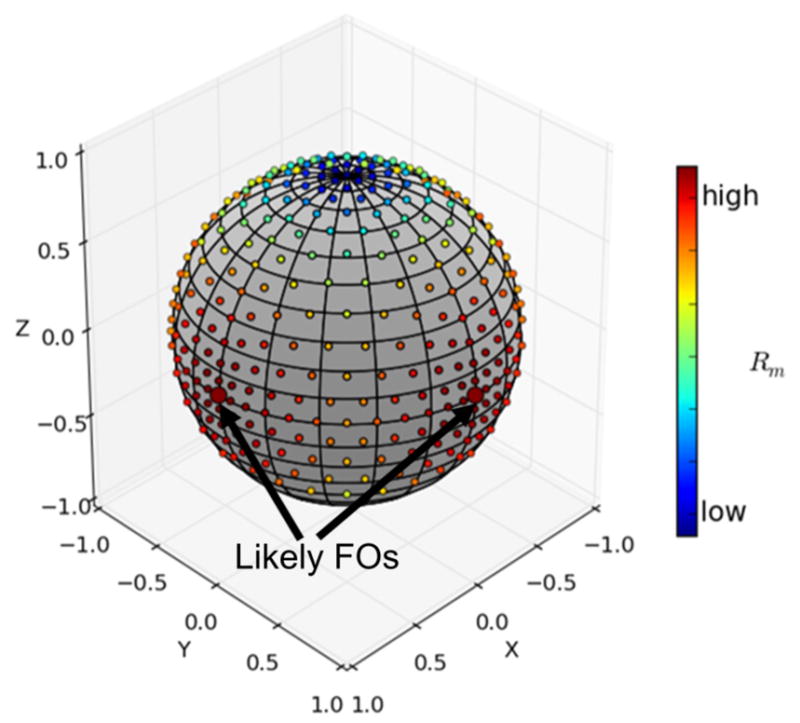
Figure 5.

An example of the Rm values of a voxel in the crossing region in Figure 1. Each Rm(i) is plotted on the unit sphere according to its associated basis direction vi. The Rm values of the likely FOs are indicated by the larger dots and black arrows.
