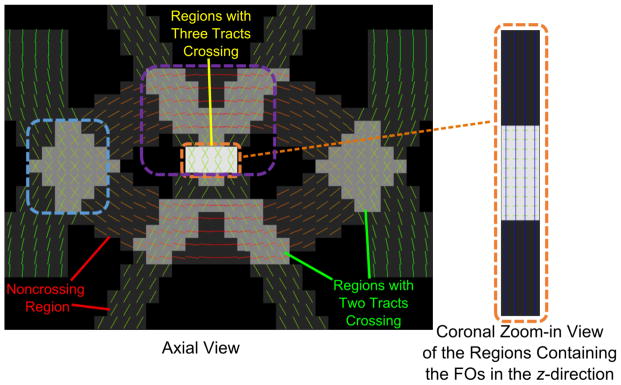
Figure 7.
Ground truth FOs overlaid on the map indicating the number of FOs at each voxel. The FOs in the z-direction are shown in a coronal view. The regions highlighted by the dashed boxes are later zoomed in for qualitative evaluation in Figure 8. The visualization of FOs was created in FSLView (Jenkinson et al., 2012).

