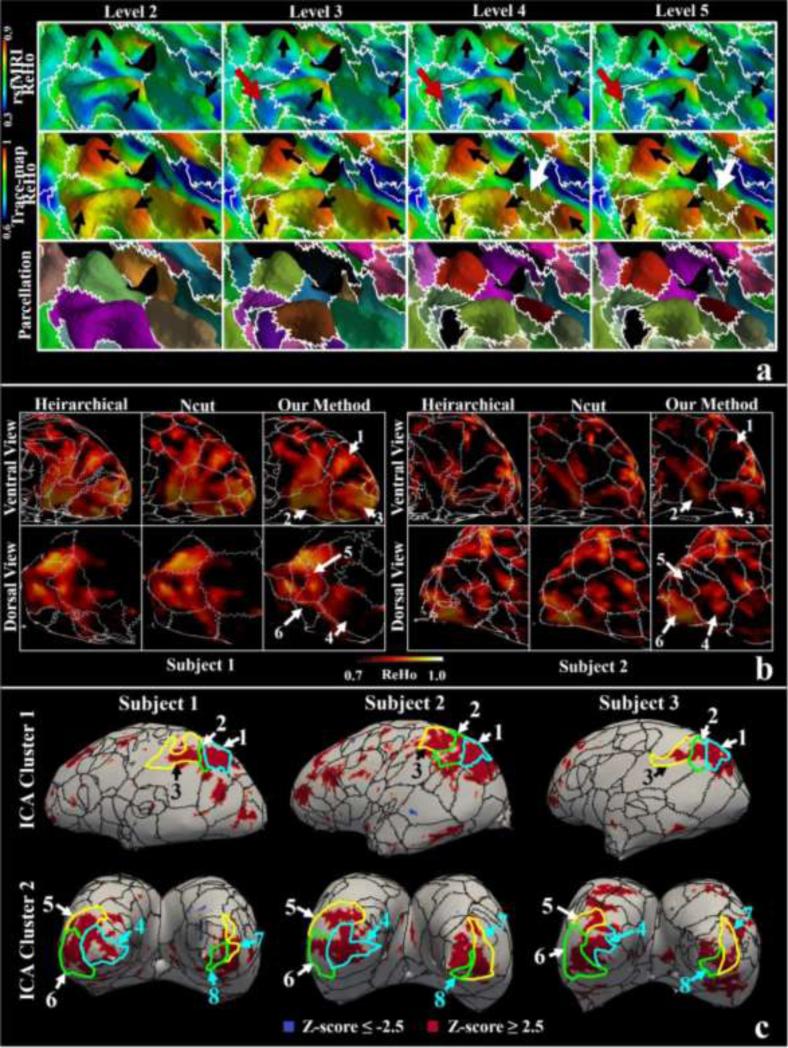
Figure 6.
Comparison of structural parcellation borders and rs-fMRI derived ReHo maps. (a) Joint visualization of parcellation borders (the white curves) and ReHo maps of one subject. The parcellation borders are overlaid on rs-fMRI derived ReHo map (the top row), trace-map-derived ReHo map (the middle row) and parcellated surfaces (the bottom row). The interpretation of arrows is referred to the main text; (b) Parcellation borders (at a resolution of 252 parcels) via different parcellation methods are overlaid over ReHo maps (visual cortices) on a scale of 0.7 to 1. Numbered arrows indicate correspondent parcels obtained from our methods. (c) Parcellation borders (at a resolution of 252 parcels) via our methods are overlaid over two ICA clusters derived from rs-fMRI. Corresponding parcels, indicated by numbered arrows, are highlighted by the borders with the same color.

