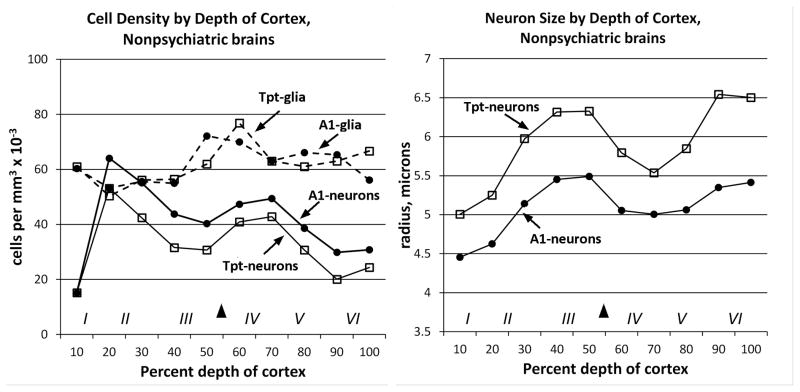
Figure 2.
Total neuron and glia densities and sizes from non-psychiatric brains are graphed by percent depth of cortex. In each graph the black arrowhead shows the location of the top of layer IV, and the Roman numerals show the approximate location of cortical layers. A) Cell density measurements showed that area A1 (filled symbols) had higher neuron density than area Tpt (open symbols) across the depth of cortex. Glia densities (dashed lines) were similar in A1 and Tpt. B) Neuron size measurements showed that area A1 had smaller neurons in all layers compared to area Tpt. Glia sizes were not measured.

