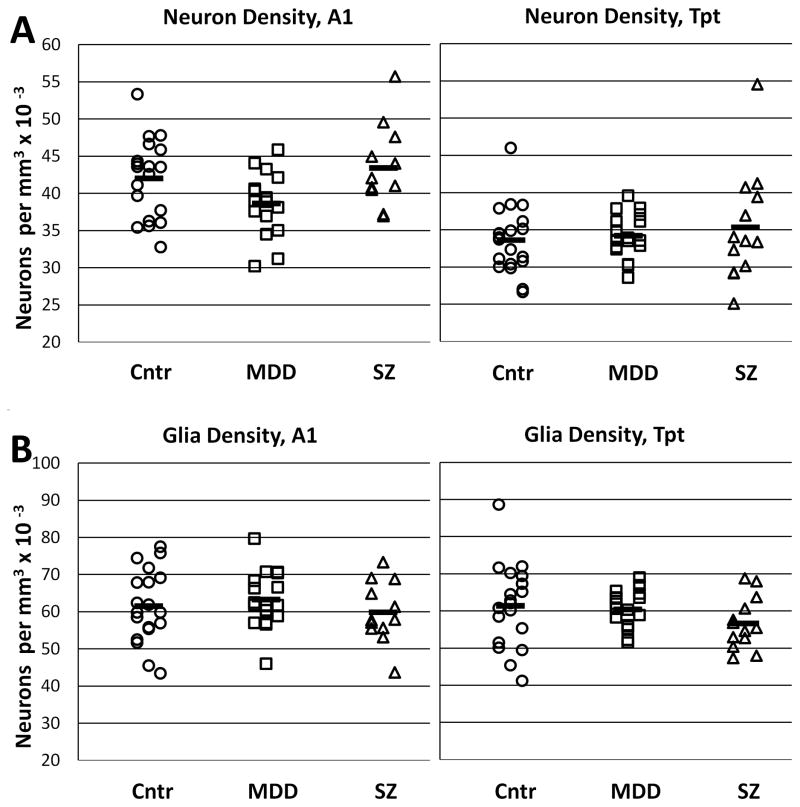
Figure 3.
Graphs show total neuron and glia densities in areas A1 and Tpt. A) Neuron densities were slightly lower in area A1 in MDD subjects, but this difference was not evident in area Tpt, and was not statistically significant. B) Glial densities were similar in both areas and in all three diagnostic groups. Cntr = non-psychiatric control group.

