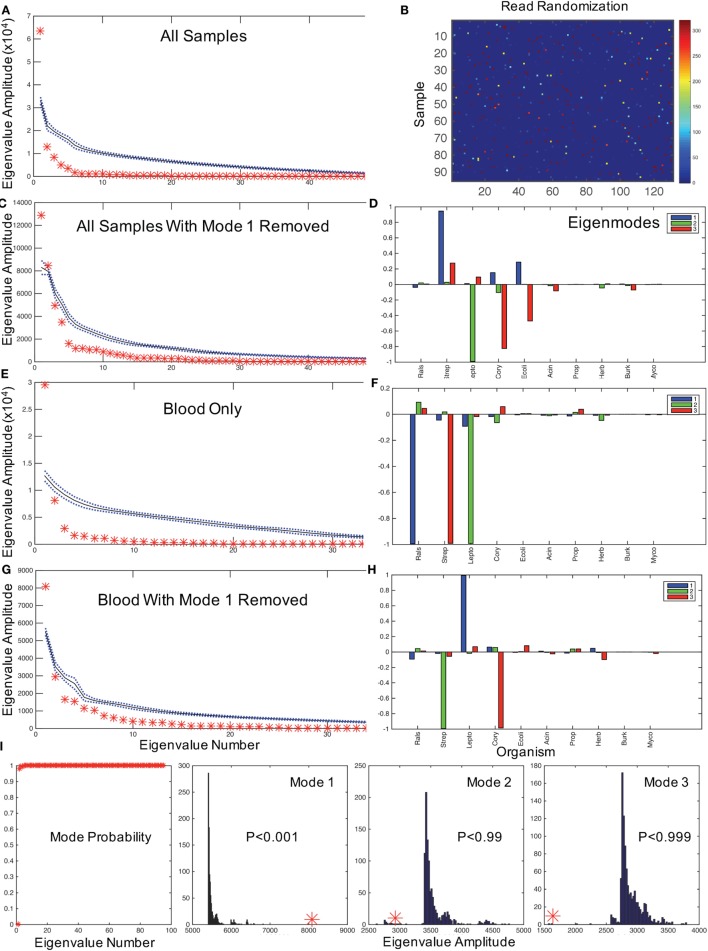
Figure 2.
Hypothesis testing for modes using random matrices. (A) Random matrix bootstrap ensemble distribution for all samples showing the mean (black solid line) and ±1 SD (blue dotted lines) for 1000 randomizations of all matrix eigenvalue amplitudes, and original data set eigenvalues (red asterisks). (B) Graphical representation of a randomization of Figure 1A using same color map scale. (C) All samples with mode 1 removed, and comparable mode composition in (D). (E) shows eigenvalue distribution for blood samples only, with mode composition in (F). (G) shows eigenvalues for blood with mode 1 removed, and in (H) the mode composition. (I) illustrates the probabilities of obtaining the first mode eigenvalues for all eigenvalues, and the bootstrap histograms that underlie the probabilities of the first three modal eigenvalues from (G,H) illustrating the significance of dominant Leptospira mode from (H) (similar results randomizing only by bacterial type not shown). Note that by removing the mode dominated by Ralstonia in the blood sample, the Leptospira dominant mode has an eigenvalue far larger than any eigenvalue generated from the randomized dataset. In contrast, the next two modes generate relatively small eigenvalues compared with the bootstrapped values. These results demonstrate that with the removal of the contaminating mode, it is highly statistically unlikely that random contamination was responsible for the pattern of Leptospira reads observed.

