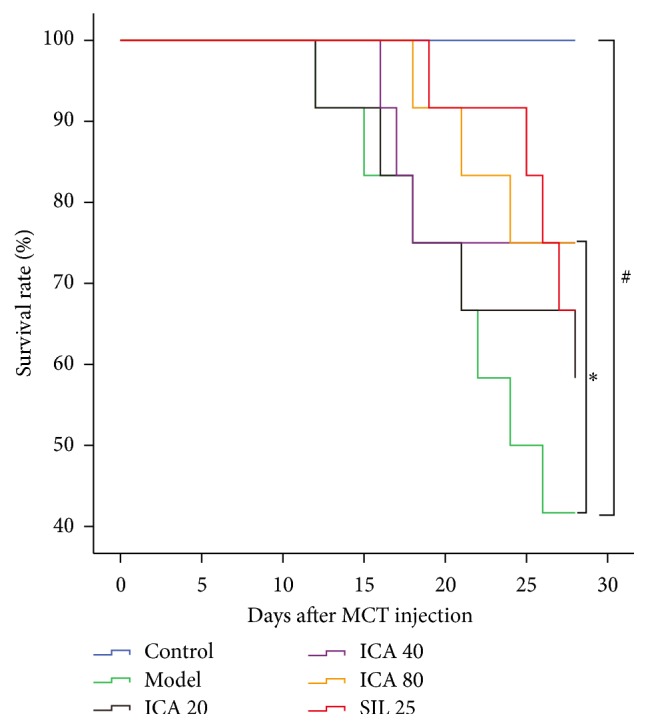
Figure 1.

Effect of ICA on survival rates. Dose: mg/kg/d. Mortality was observed daily and the figure shows the survival rate at each time point, setting the survival rate at the start of model established as 100%. In order to easily read, the survival rates data of L-arg treatment groups, L-arg (200 mg/kg/d) with L-NAME (20 mg/kg/d) group, and ICA (40 mg/kg/d) with L-NAME (20 mg/kg/d) group are not presented in Figure 1. Compared with control group # p < 0.05, compared with model group ∗ p < 0.05, Log-Rank test.
