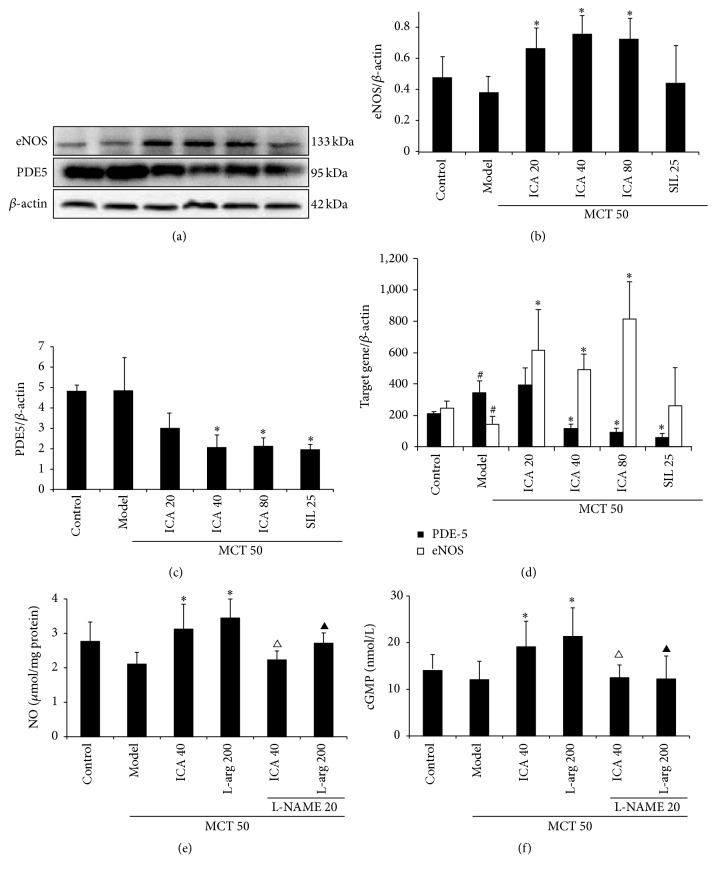
Figure 6.
ICA enhances function of NO/cGMP signaling pathway in MCT-PH model rats (mean ± SD, n = 5–12). Dose: mg/kg/d. (a) Representative Western blots from lung homogenate; (b) quantitative bar graph of eNOS expression of lung tissue; (c) quantitative bar graph of PDE5 expression of lung tissue. (d) Bar graph of eNOS and PDE5 mRNA expression; (e) bar graph of NO content of lung tissue; (f) bar graph of cGMP content of lung tissue; compared with control group # p < 0.05; compared with model group ∗ p < 0.05; compared with ICA (40 mg/kg/d) group △ p < 0.05; compared with L-arg (200 mg/kg/d) group ▲ p < 0.05.

