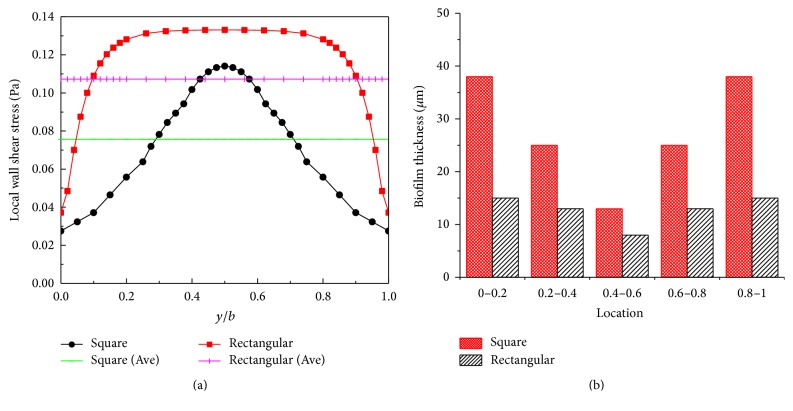
Figure 6.
The distribution of the wall shear stress along the base wall for both the rectangular and square channels and the laboratory measured the thickness of the biofilm. (a) The distribution of the wall shear stress along the base wall for the rectangular channel. The pink line indicates average value of wall shear stress in rectangular channel; the cyan line indicates average value of wall shear stress in square channel. (b) The experimental data of biofilm thickness in rectangular and square channel.

