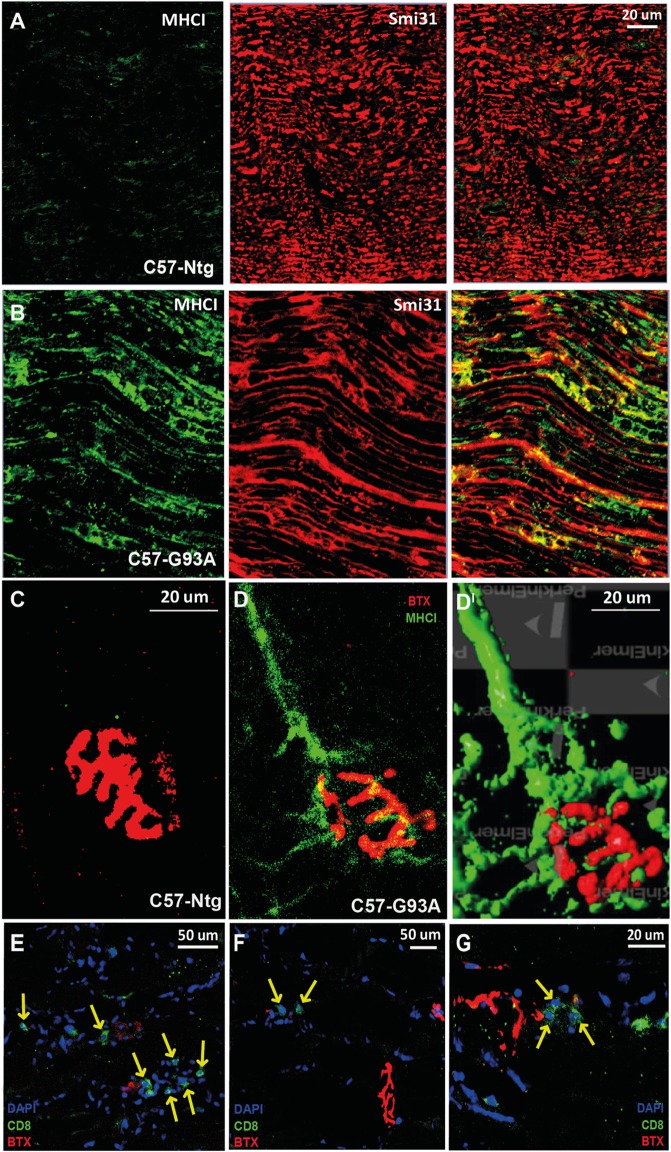
Figure 4.
MHCI activation and CD8+ T cell infiltration in the neuromuscular system of SOD1G93A mice at disease onset. (A,B) Confocal micrographs of the sciatic nerve of C57SOD1G93A mice at disease onset showing remarked upregulation of MHCI (green) and colocalization with Smi31 (axonal marker; red) in pathological conditions. (C,DI) Confocal micrographs from tibialis anterior muscle of (C) Ntg and (D) C57-G93A mice showing accumulation of MHCI at the NMJ under pathological conditions (BTX; α-bungarotoxin; postsynaptic marker). (DI) 3D rendering of (B) from the same angulation (Volocity – Perkin Elmer). (E–G) Confocal micrographs showing the presence cytototoxic T cells (CD8, green) in the tibialis anterior muscle of C57-G93A mice in proximity to NMJs, indicated by yellow arrows.

