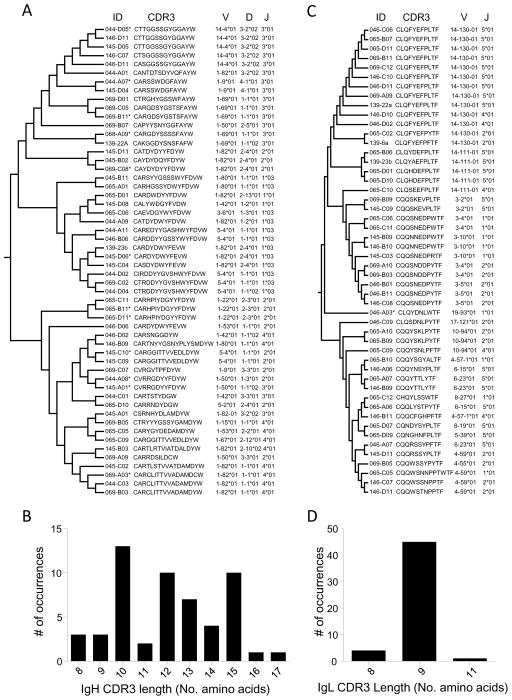
Figure 3. IgH V, D and J IgL V and J gene combinations and CDR3 sequences.
CDR3 sequences were aligned using MUSCLE [1] and a maximum likelihood dendrogram was generated using MEGA5 for IgH (A) and IgL (C). Columns indicate the IgH or IgL identifier (“ID”), the CDR3 sequence (CDR3), and the identity of the V, D, and J (IgH) or V and J (IgL) gene segments used. “*” indicates the segment was sequenced but not cloned. The overall distribution of IgH (B) and IgL (D) CDR3 length.

