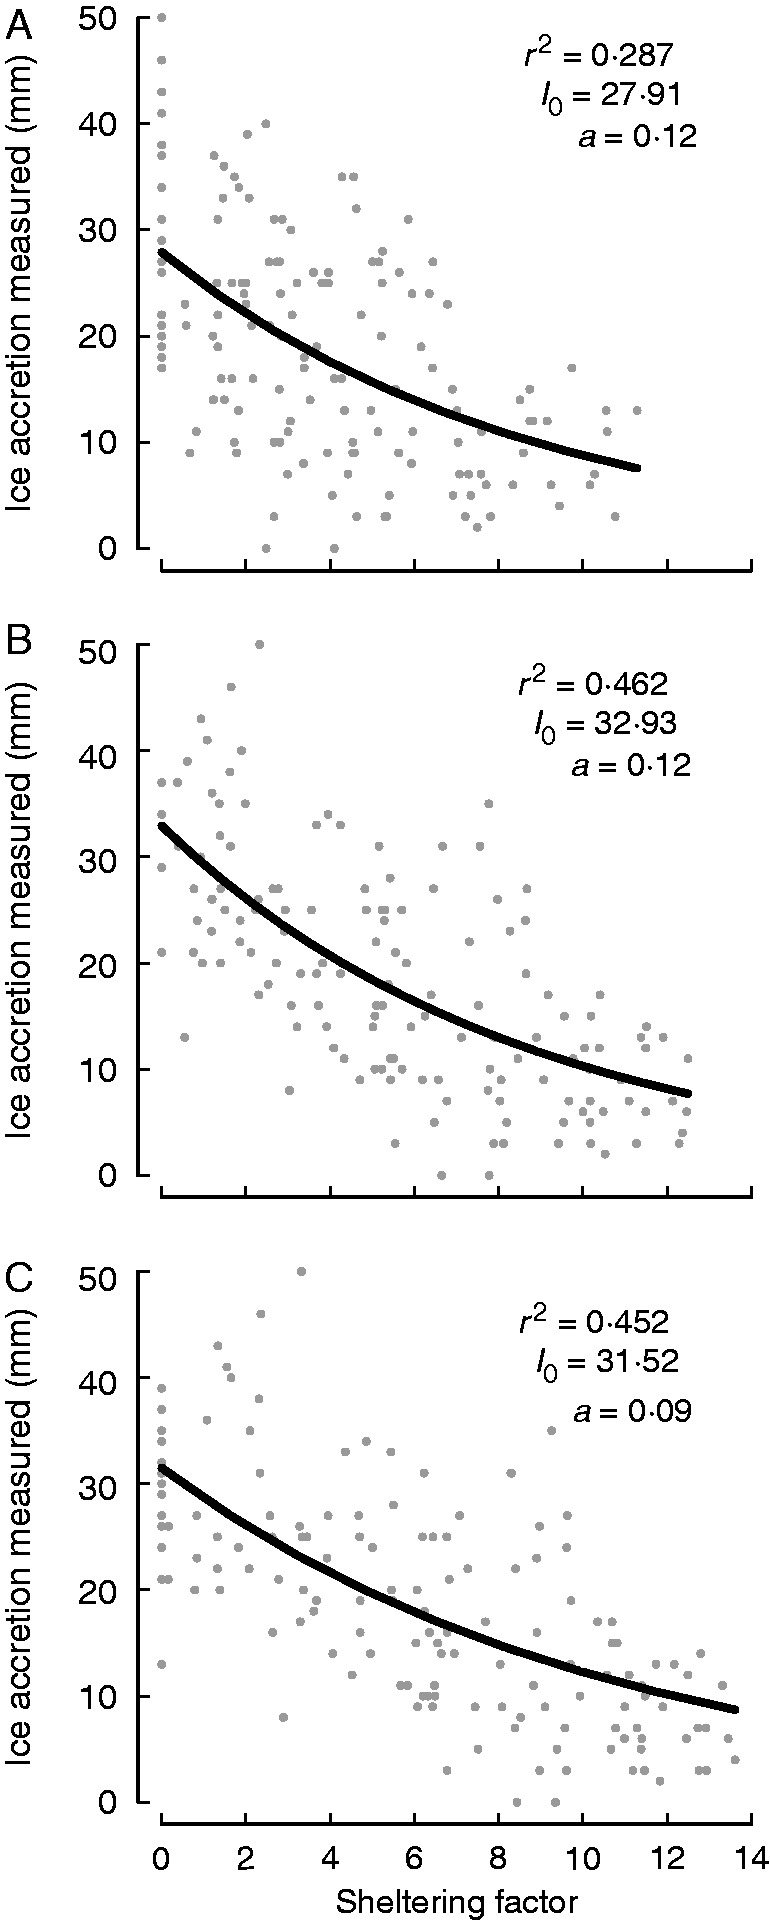
Fig. 5.

Relationship between measured ice radius (always for t1; 6·5 h of icing) on branch segments and SF calculated for the tree point cloud at different times: (A) SF calculated for t0 (pre-icing), (B) weighted SF (proportions: 0·3 for t0 and 0·7 for t1) for t0 and t1, and (c) SF at t1. The black line corresponds to the modelled relationship based on the Beer–Lambert extinction model (see the Materials and Methods; I0 and a are obtained by calibration).
