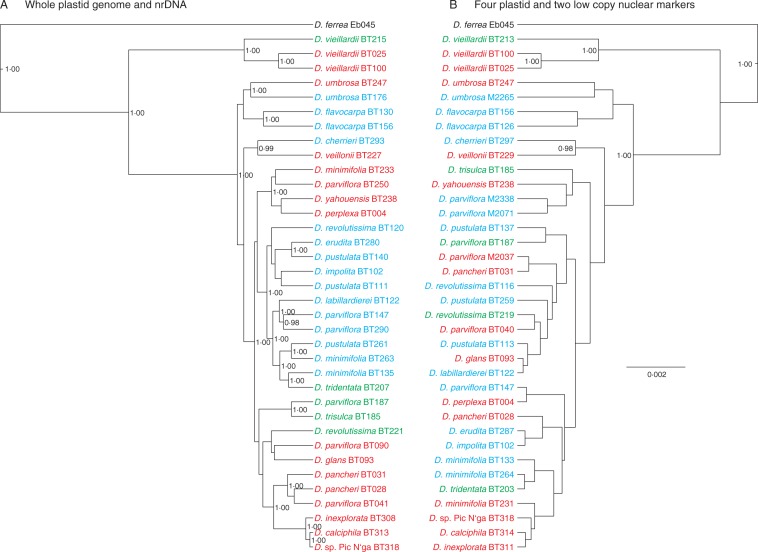
Fig. 3.
Phylogenetic trees resulting from the Bayesian analysis of the (A) combined data set of the present study (variable nucleotide positions in the whole plastid genome and nrDNA) and (B) combined data set of a previous study including four plastid and two low-copy nuclear markers (Turner et al., 2013a). The numbers indicate posterior probabilities >90. Trees are scaled to the same branch length. Samples are coloured according to sampling region (see Fig. 1).

