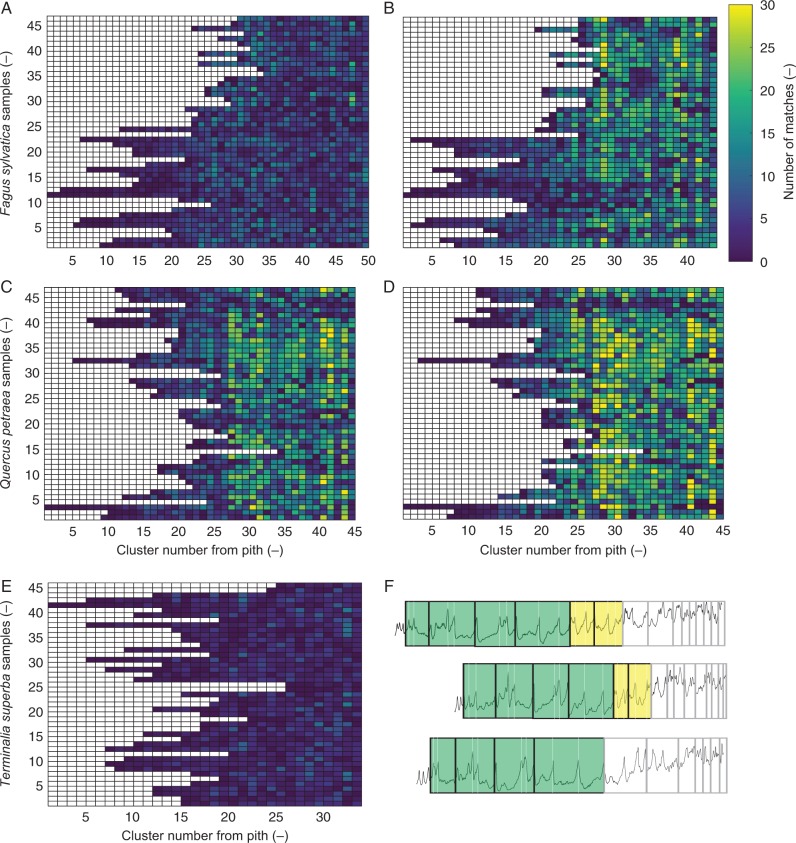
Fig. 6.
Matrix plots of the number of density-based matched clusters (A) before and (B) after cross-dating of Fagus sylvatica as a function of the sample and the position of the cluster within the sample. (C and D) The same for Quercus petraea. The colour scale of each element represents the number of clusters that it has in common with other profiles in that same cluster number. The same colour scale is used for the three species. After cross-dating, a higher number of clusters is found (cluster size 3). The number of clusters is different before and after cross-dating due to adding/deleting ring indications. (E) For Terminalia superba, few matches are found due to (F) difficult matching of small rings.

