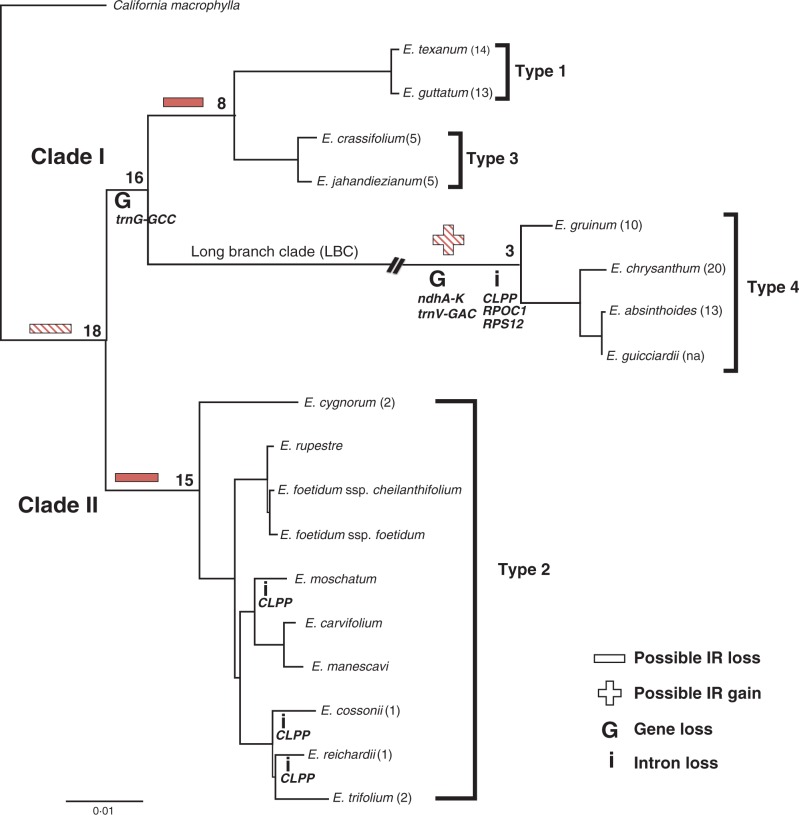
Fig. 1.
Phylogram depicting relationships among selected Erodium species. The maximum likelihood tree (score 70^914·4940 lnL) was generated from a concatenated alignment of sequences of 19 protein-coding genes (26 985 bp) for 18 Erodium species and the outgroup California macrophylla and represents the constraint topology for rates analyses. The two major clades (sensu Fiz et al., 2006) within the genus are labelled along with the long branch clade (LBC) and the four types of plastome characterized. The branch leading to LBC has been interrupted for concision. The number of inversions relative to California is given in parentheses after each species. Numerals at the nodes indicate divergence time estimates (Fiz et al., 2008). The two hatched and two solid symbols (+/–) indicating IR status represent paired events that are alternatives of each other as discussed in the text. Gene and intron losses are indicated on the relevant branches. The scale bar indicates the number of substitutions per site.

