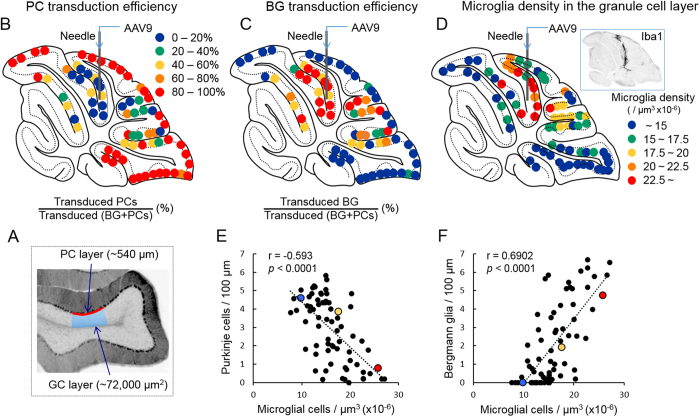
Figure 3. Correlation of the density of transduced PCs or that of BG with adjoining microglial density.
(A) Schema depicting areas that were used to count PCs, BGs and microglia. The numbers of GFP-expressing PCs and BGs along the approximately 540-μm PC layer (as indicated by a red line) were counted in various transduced areas in the sagittal section of the cerebellum and the number of microglia that were present in the contiguous granule cell layer and half of the medulla (approximately 72,000 μm2) just beneath the measured PC layer (as depicted with a blue rectangle). (B) Map depicting the PC transduction efficiency. Each dot represents the percent ratio of transduced PCs to transduced (BGs + PCs) in the sagittal section of the cerebellum. Based on the percentage, the ratios were evenly classified into 5 groups with distinct colours as indicated. (C) Map depicting the BG transduction efficiency. Each dot represents the percent ratio of transduced BGs to transduced (BGs + PCs) in the sagittal section of the cerebellum. (D) Map of the microglial density in different areas of the granule cell layer in the sagittal section of the cerebellum. Based on the cellular density, the results were classified into 5 groups with distinct colours as indicated. Inset shows a representative image of the cerebellar section that was immunolabelled for Iba1, showing strong Iba1 immunoreactivity along the needle track. (E,F) Graphs showing the correlation of transduced PC efficiency (E) or transduced BG efficiency (F) with the density of microglia (Spearman’s rank correlation coefficient, (E) r = −0.593, p < 0.0001, (F) r = 0.6902, p < 0.0001). Numbers of GFP-expressing PCs and BG per 100 μm PC layer were plotted against the microglial density in the adjoining granule cell layer (μm3 × 10−6).

