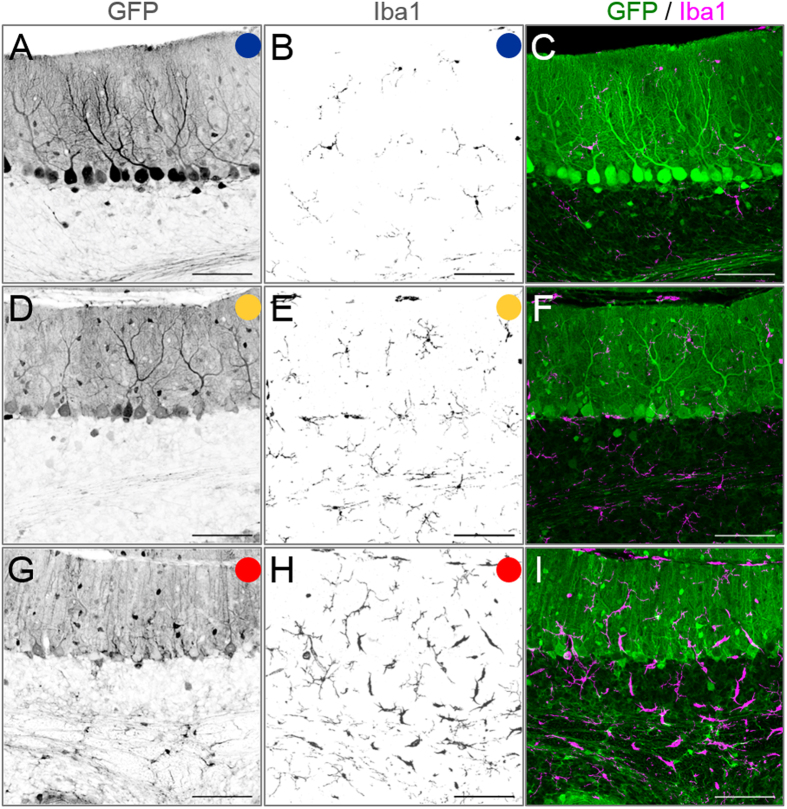
Figure 4. Representative fluorescent images of the cerebellar cortex showing the correlation of the PC or BG transduction efficiency with microglial density.
Mice received AAV9 vectors expressing GFP under the control of the NSE promoter. The cerebellar slices that were produced 1 week after the injection were double immunostained for GFP and Iba1, a marker of microglia. Left and middle panels show images that were immunolabelled for GFP and Iba1, respectively. Right panels are merged images of GFP and Iba1. Each image with blue, yellow or red circle corresponds to dots of the same colour as in Fig. 3E,F. Scale bar, 100 μm.

