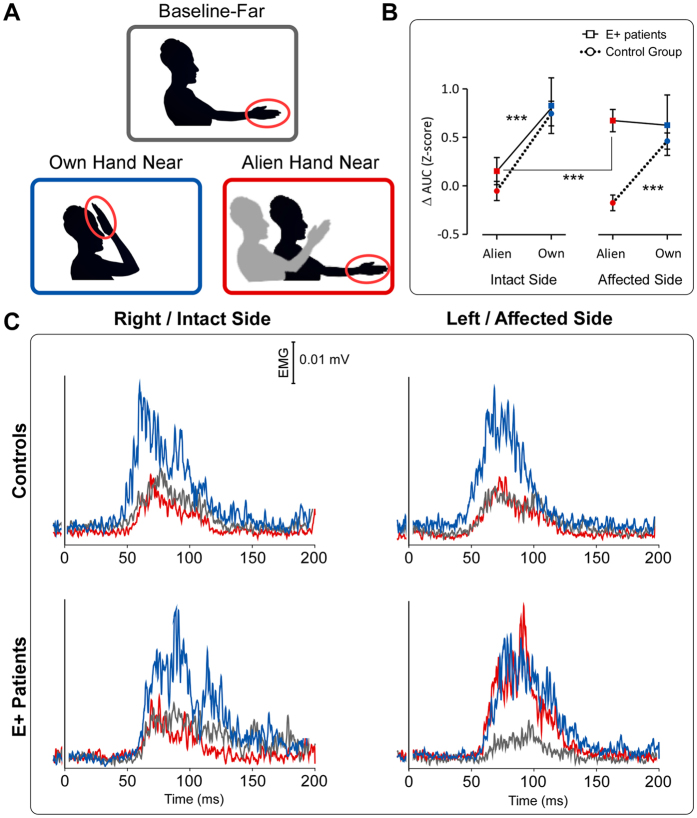
Figure 1. Conditions, group-average waveforms and results.
(A) Experimental Conditions. (B) ANOVA results. Graphs show the AUC HBR mean values (Z-scores) with standard errors for the own-hand and the alien-hand condition, expressed as difference with respect to the baseline, in both Controls group (N = 10) and E+ patients (N = 5). ***P < 0.0001. (C) Controls’ (Top) and E+ patients’ (Bottom) Group-average, rectified HBR waveforms; x-axis, Time (ms); y-axis EMG activity (mV) in all three conditions, in both the intact/right and the affected/left body-side.

