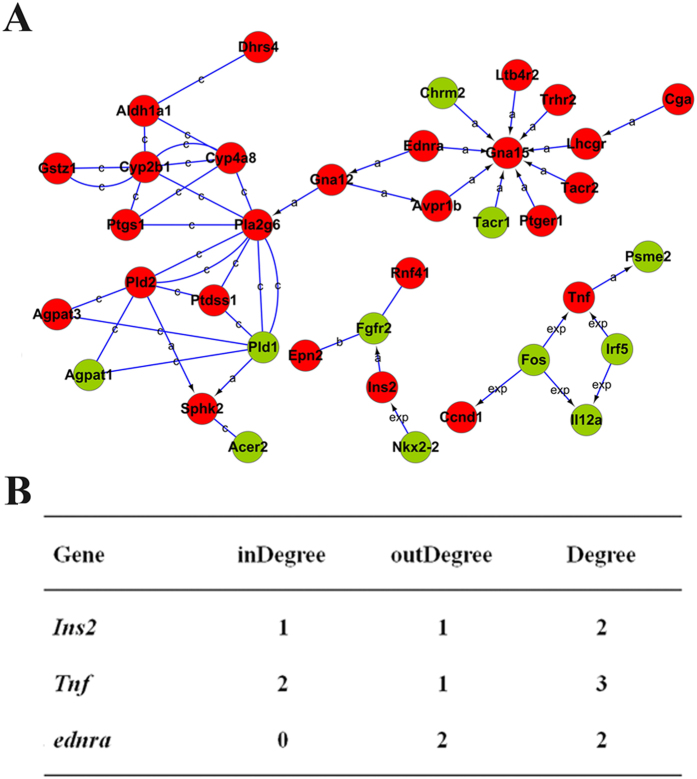
Figure 3. Interactions and functional network identified by KEGG.
(A) The KEGG database was used to build the network of genes involved in T1D according to the relationship among the differentially expressed genes between BDE47 treatment and control groups. Genes in red and green indicate over- and under-expressed genes, respectively. a, activation; b, binding; c, compound; exp, expression. P-value, probability that the association between the 2-fold differentially expressed genes and the canonical pathway can be accounted for by chance only. (B) The degree of involved genes in the gene-act-network. Degree centrality is defined as the link numbers that one node has to the other. InDegree, the number of genes acts on the specific gene; OutDegree, the number of genes is acted on by the specific gene. In the network analysis, degree centrality is the most simplest and important measure of the centrality of a gene within a network that determines the relative importance.

