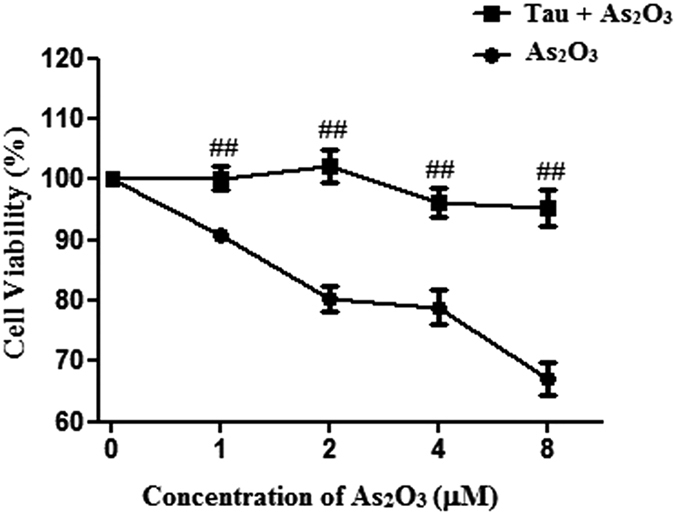
Figure 10. Effect of Tau on the cell viability of As2O3-treated HepG2 cells.

Before incubation with 1 μM As2O3 for 24 h, the cells were pretreated with 20 μM Tau for 6 h. The cell viability was assessed using the MTT assay. The trace represents the means ± SD. (##P < 0.01 vs. cells not treated with Tau and treated with the respective As2O3 concentration, n = 2).
