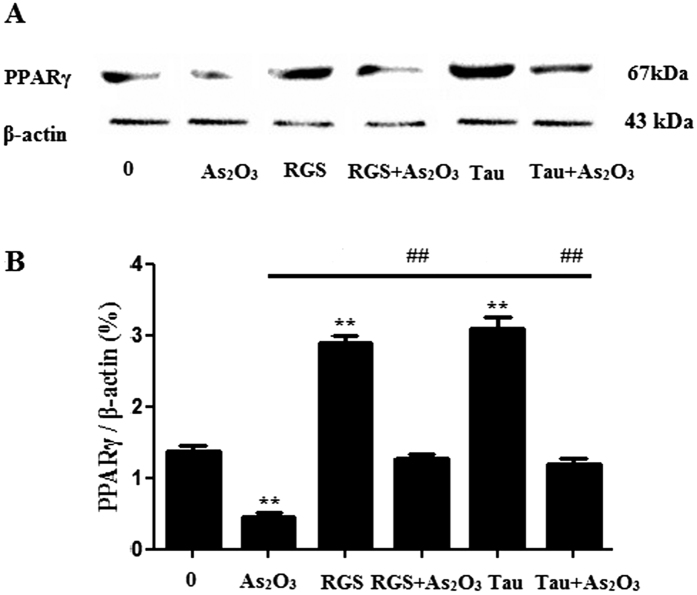
Figure 11. PPARγ protein levels in As2O3-treated HepG2 cells.
(A) Before incubation with 1 μM As2O3 for 24 h, the cells were pretreated with 100 μM RGS and 20 μM Tau respectively for 6 h. The protein fraction was analyzed by Western blot. β-actin was taken as internal control. (B) Densitometric analyses of PPARγ levels in HepG2 cells (**P < 0.01 vs. control; ##P < 0.01).

