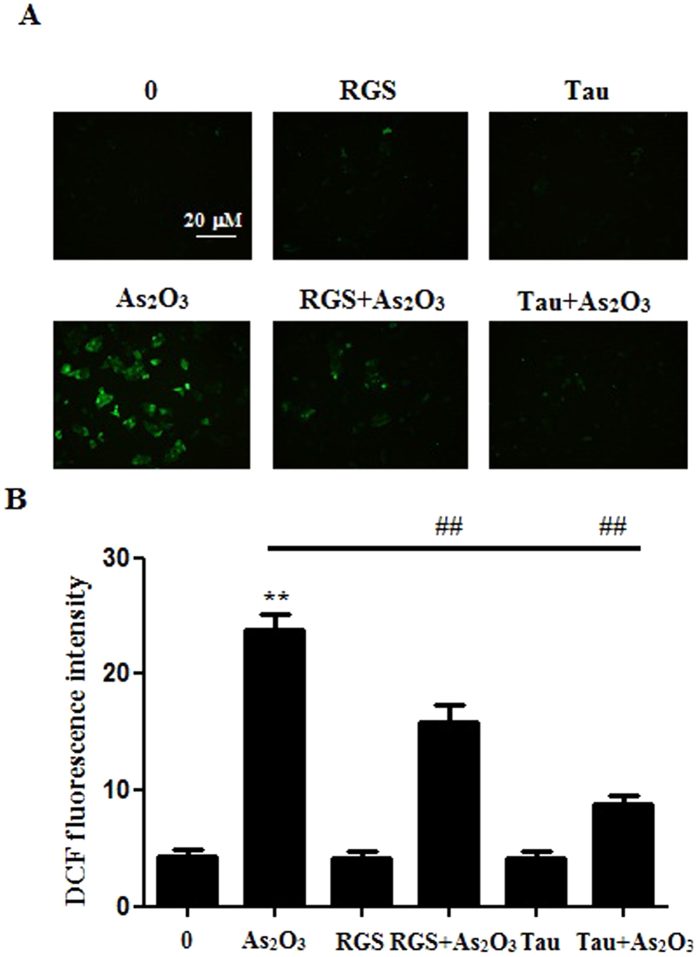
Figure 12. The generation of ROS in As2O3-treated HepG2 cells.
(A) Before incubation with 1 μM As2O3 for 24 h, the cells were pretreated with 100 μM RGS and 20 μM Tau respectively for 6 h. Representative fluorescence microscopic images showing the fluorescence of DCF oxidized by intracellular ROS in HepG2 cells. After treatment, the cells were incubated with 5 μM DCFH-DA for 15 min in the dark and assessed by fluorescence microscope (scale bar = 20 μM). (B) The fluorescence intensity of the generation of ROS in As2O3-treated HepG2 cells (n = 6, **P < 0.01 vs. control; ##P < 0.01).

